Fig. 3.
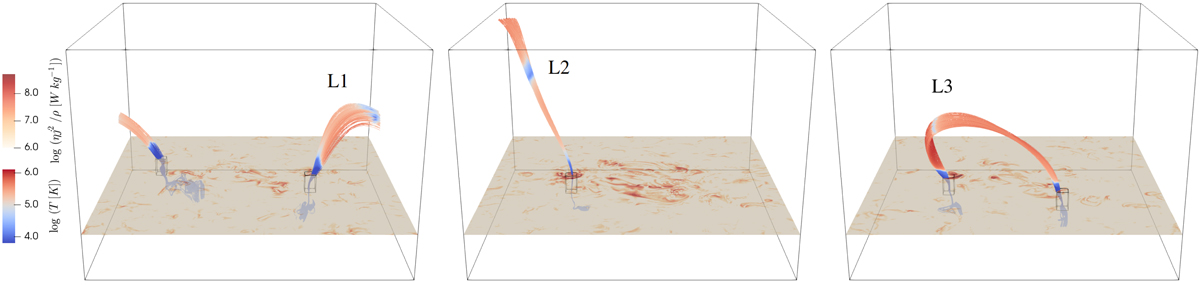
Snapsots of thermally unstable loops L1, L2, and L3 which form cool and dense condensations taken at t = 1230 s, t = 430 s, and t = 180 s, respectively. We show 100 field lines which intersect the condensation in each loop, with their colour corresponding to the temperature of the plasma. The surface at z = 1.2 Mm shows the concentrations of strong Joule heating in the chromosphere. The regions outlined in black with physical extent of 1 Mm × 1 Mm × 1.5 Mm mark the loop footpoint regions in the lower atmosphere.
Current usage metrics show cumulative count of Article Views (full-text article views including HTML views, PDF and ePub downloads, according to the available data) and Abstracts Views on Vision4Press platform.
Data correspond to usage on the plateform after 2015. The current usage metrics is available 48-96 hours after online publication and is updated daily on week days.
Initial download of the metrics may take a while.