Fig. 1.
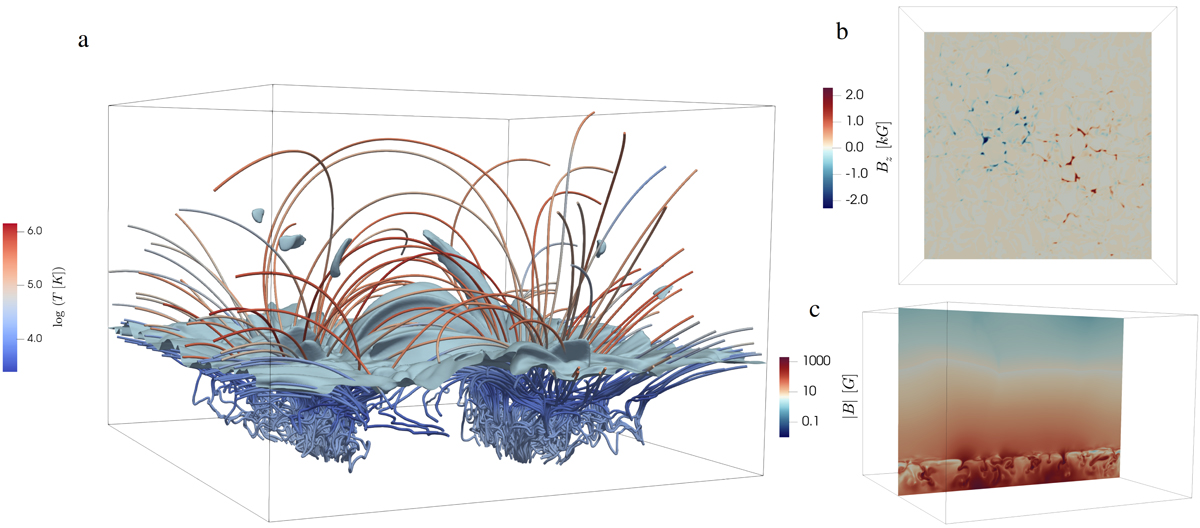
Panel a: magnetic configuration of the simulation domain with physical size of 24 × 24 × 16.8 Mm at t = 180 s after the non-equilibrium ionisation of hydrogen has been switched on. The colour of the individual magnetic fieldlines corresponds to their temperature. The 5 × 10⁻¹² kg m−3 density isosurface is shown in blue. Several cool and dense condensations have formed at coronal heights. Panel b: line-of-sight component Bz of the photospheric magnetic field at z = 0. Panel c: variation of the magnitude of magnetic field strength in vertical direction at y = 12 Mm. An animation of this figure is available online.
Current usage metrics show cumulative count of Article Views (full-text article views including HTML views, PDF and ePub downloads, according to the available data) and Abstracts Views on Vision4Press platform.
Data correspond to usage on the plateform after 2015. The current usage metrics is available 48-96 hours after online publication and is updated daily on week days.
Initial download of the metrics may take a while.