Fig. 8.
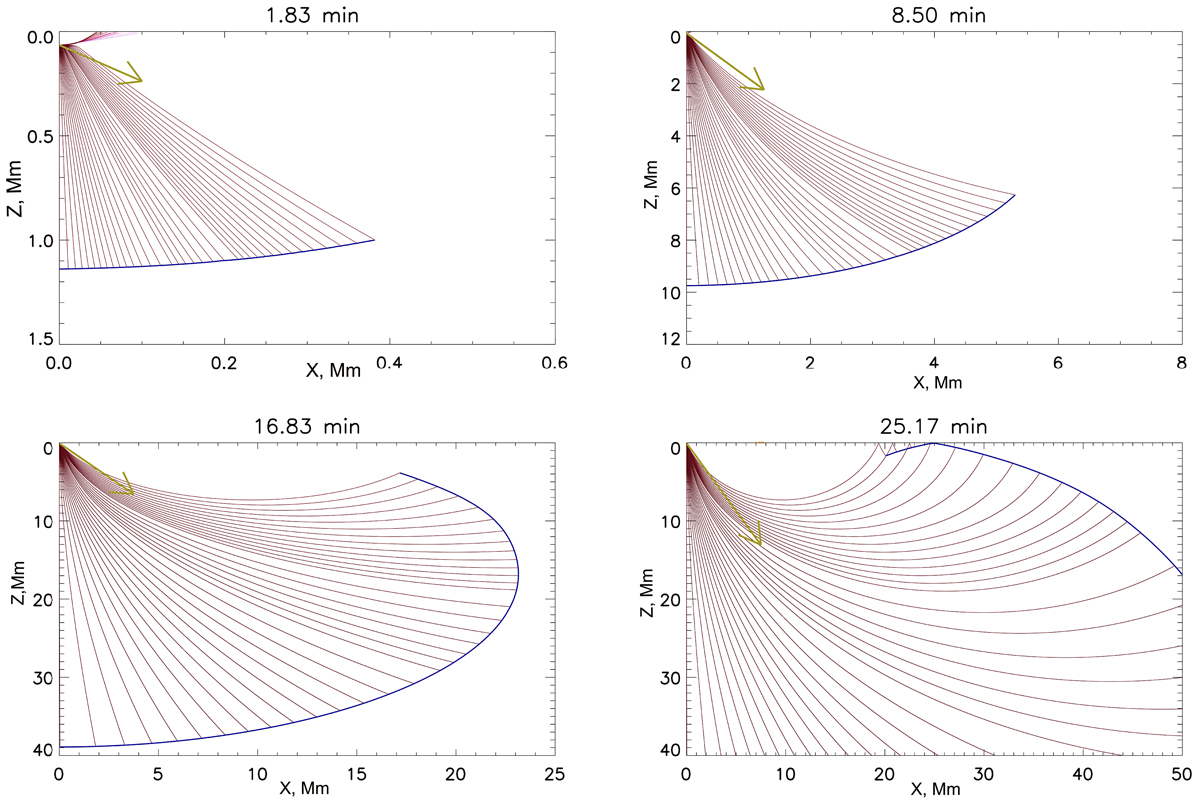
Individual acoustic rays generated at the depth of 1 km in the solar interior and travelling along the Z direction to the bottom of the plot by a moving supersonic source, v = 120 km s−1, depositing a momentum below the photosphere (the origin) under a −10° angle from the local vertical for the times after shock onset. This is shown above the plots and is similar to what was observed in seismic source 1. The rays were computed numerically for the parameters extracted from model S (Christensen-Dalsgaard et al. 1996). The rays are colour-coded in the range of 9–15 mHz with 9 corresponding to the darkest shade; Z is depth in the solar interior; the photosphere is denoted by Z = 0; and the X-axis denotes a distance on the surface in Mm from the point of the momentum deposition. The mustard arrow shows the direction of the wave propagation. The points of the ray reflection from the photosphere seen in the top right corner at 25:17 min from the shock deposition time are observed as ripples on the surface, or a sunquake, which are propagating from the central point of the momentum deposition in the flaring event outwards to all the directions.
Current usage metrics show cumulative count of Article Views (full-text article views including HTML views, PDF and ePub downloads, according to the available data) and Abstracts Views on Vision4Press platform.
Data correspond to usage on the plateform after 2015. The current usage metrics is available 48-96 hours after online publication and is updated daily on week days.
Initial download of the metrics may take a while.