Fig. 7.
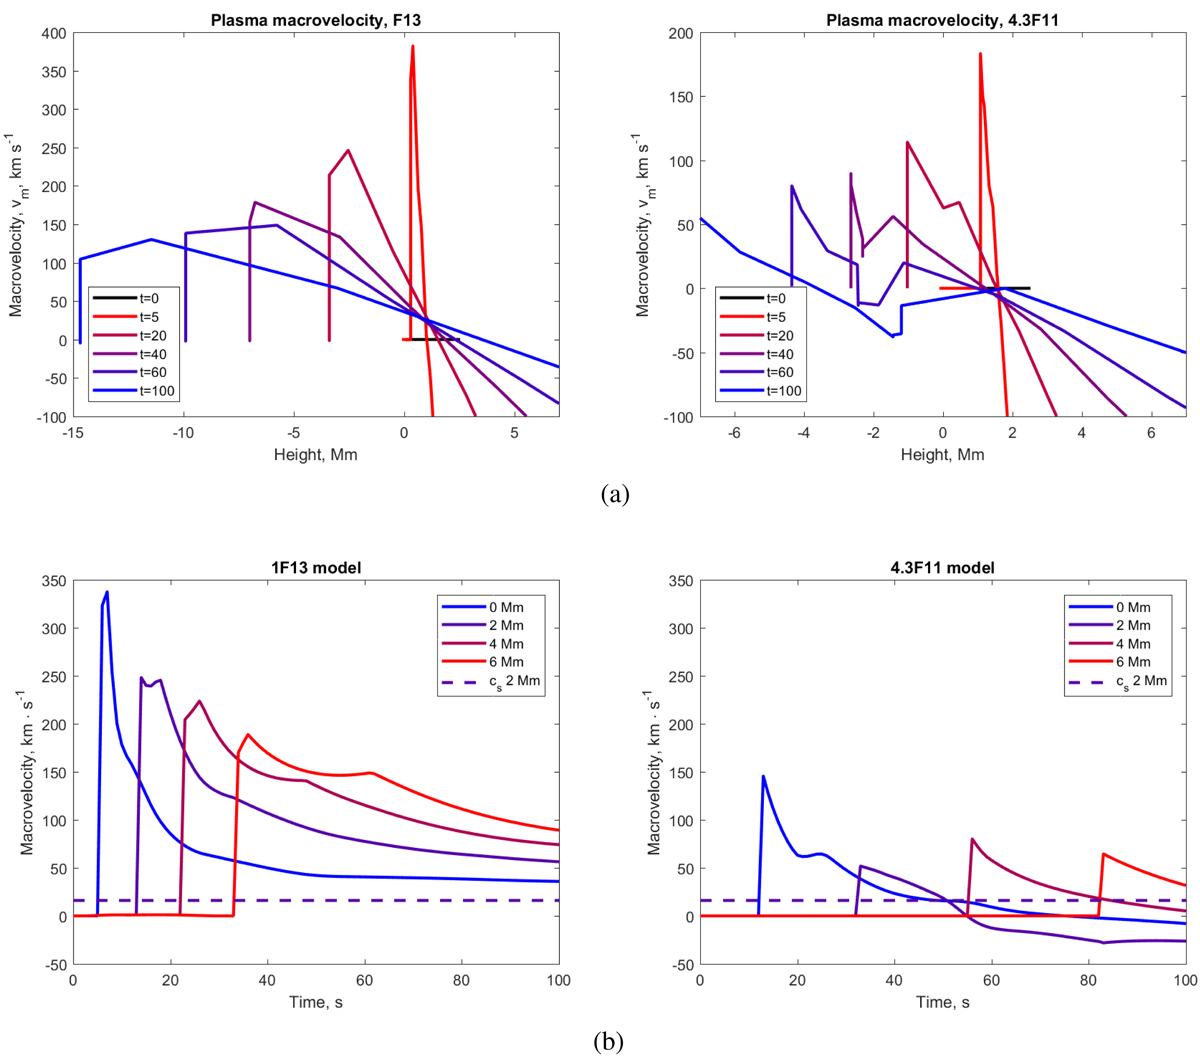
Velocity profiles of the simulated hydrodynamic shocks in seismic event 2 of the 6 September 2017 flare (left column) and in seismic event of the 6 September 2011 flare (right column) are plotted versus the linear depths under the QS photosphere for different times after beam injection (top row) and versus the time after the beam onset for different linear depths in the solar interior under the QS photosphere (bottom row). Zero in the X-axis indicates the position of the QS photosphere, the negative numbers indicate the depth under the photosphere (see text for details). The solid black line in (a) represents the sound speed in the photosphere.
Current usage metrics show cumulative count of Article Views (full-text article views including HTML views, PDF and ePub downloads, according to the available data) and Abstracts Views on Vision4Press platform.
Data correspond to usage on the plateform after 2015. The current usage metrics is available 48-96 hours after online publication and is updated daily on week days.
Initial download of the metrics may take a while.