Fig. 6.
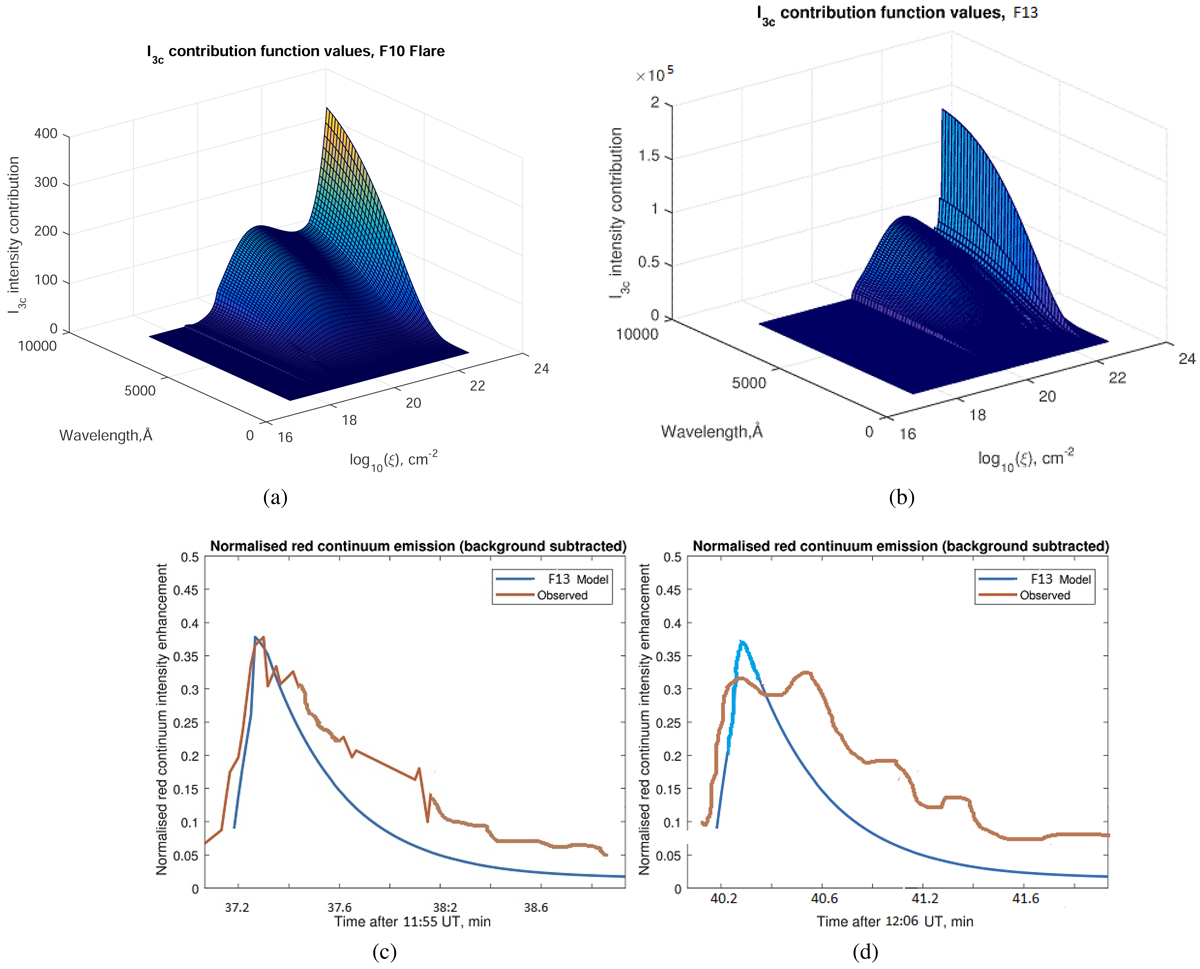
Simulated variations of the contribution functions of Paschen continuum (white light emission) derived from a radiative hydrodynamic model heated by the moderate electrons beam, model F10, (a) and by the powerful mixed beam, model F13 (b) (see the text for more details). It is important to note the difference in three orders of magnitude between the intensities in the model (F10) and (F13) plots. The comparison of the light curve of intensity of Paschen emission was generated by a mixed beam with a spectral index of 4 and an initial energy flux of 1 × 10¹³ erg cm2 s−1 with what was measured from HMI/SDO images in WL kernel 1, coinciding with Hα kernel 1 (c), and in WL kernel 2, coinciding with Hα kernel 3 (d).
Current usage metrics show cumulative count of Article Views (full-text article views including HTML views, PDF and ePub downloads, according to the available data) and Abstracts Views on Vision4Press platform.
Data correspond to usage on the plateform after 2015. The current usage metrics is available 48-96 hours after online publication and is updated daily on week days.
Initial download of the metrics may take a while.