Fig. 5.
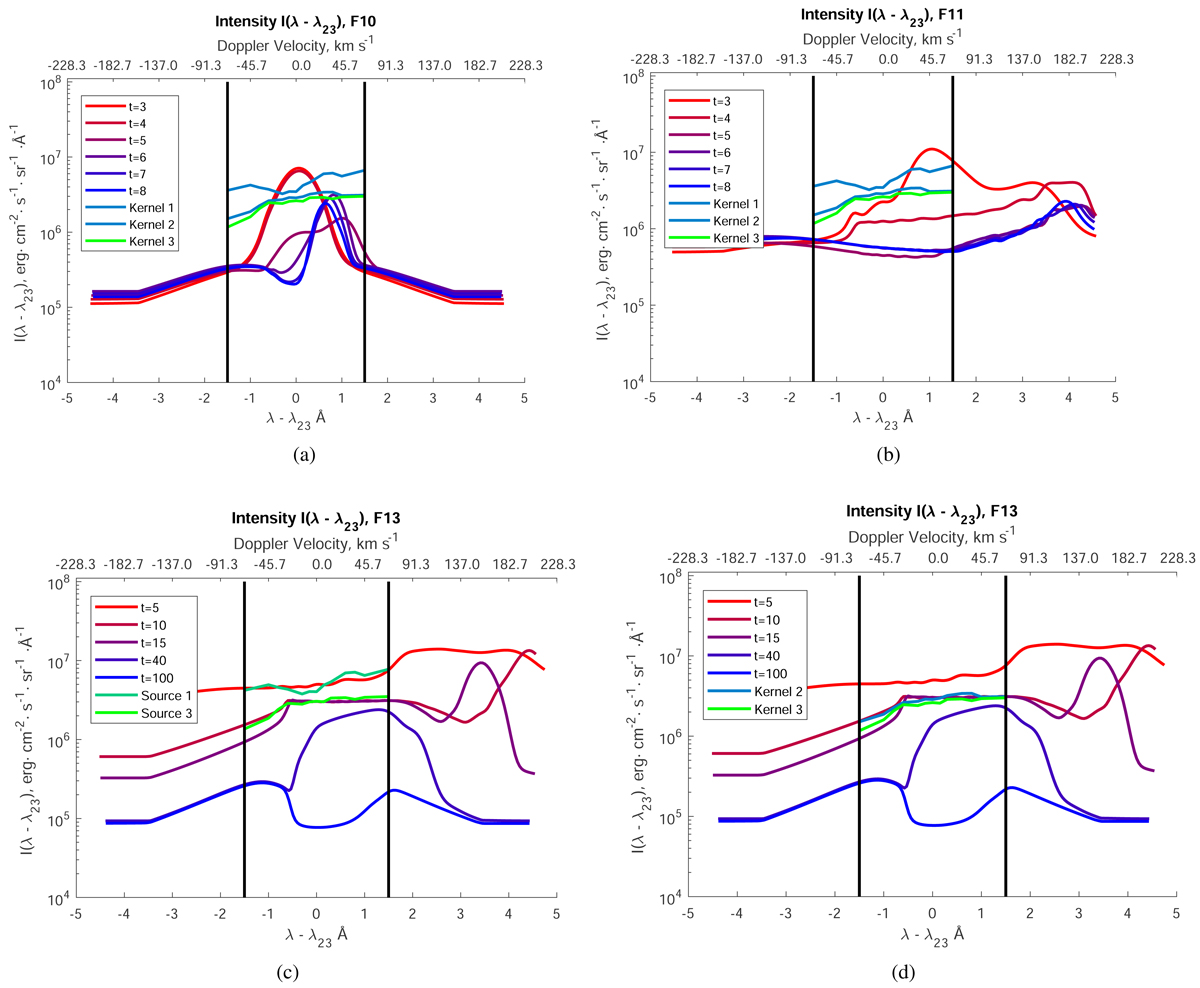
Observed Hα-line profiles in kernels 1-3 overplotted on the Hα line profiles simulated with the HYDRO2GEN code (Druett & Zharkova 2018) in flaring atmospheres produced by the following. (a) An electron beam with a spectral index of 4 and an initial energy flux of 1010 erg⋅cm−2s−1. (b) An electron beam with a spectral index of 4 and an initial energy flux of 1011 erg⋅cm−2s−1. (c) A mixed beam with a spectral index of 4 and an initial energy flux of 1013 erg⋅cm−2s−1. (d) A mixed beam with the same parameters as in (c). The observed Hα line profiles are shown in kernel 1 (blue line), kernel 2 (light blue line), and kernel 3 (green line). The vertical lines show the spectral window ±1.5 Å for the CRISP/SST Hα line observations.
Current usage metrics show cumulative count of Article Views (full-text article views including HTML views, PDF and ePub downloads, according to the available data) and Abstracts Views on Vision4Press platform.
Data correspond to usage on the plateform after 2015. The current usage metrics is available 48-96 hours after online publication and is updated daily on week days.
Initial download of the metrics may take a while.