Fig. 10.
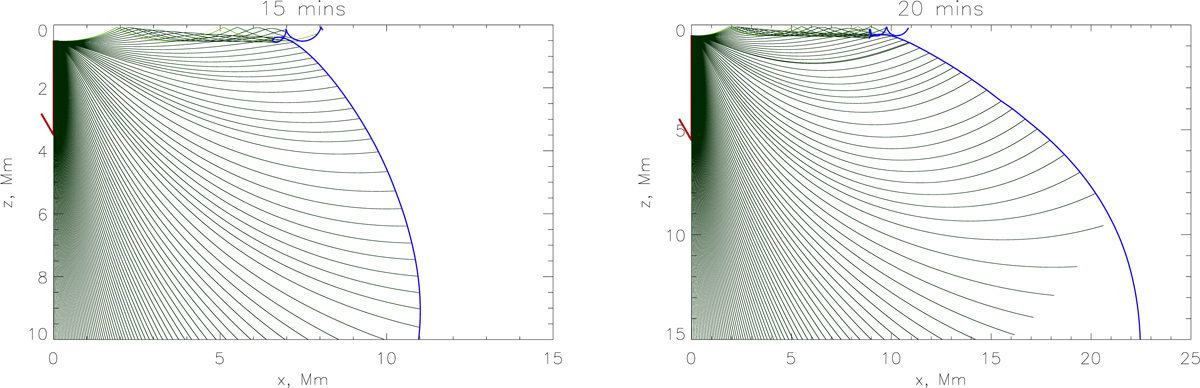
Individual acoustic rays travelling to the bottom of the plot generated in the interior by a moving supersonic source with an average speed of v = 200 km s−1 as in seismic source 2 at the times denoted on the top of each panel. The shock is inclined by −30° to the local vertical. Note that Z is the depth in the solar interior, the photosphere is denoted by Z = 0, and the X-axis denotes a distance on the surface in Mm from the point of the momentum deposition. The mustard arrow shows the direction of the wave propagation. The points of reflection from the surface, or ripples of the first bounce, are well observed 15 min after the deposition time, starting from a distance of 2–3 Mm (on the right), and they are very well seen within 20 min at a distance starting from 3–4 Mm. The second bounce waves appear at 5 Mm within 15 min after the shock deposition and at 7 Mm within 20 min (see the top far end of the wave set marked by the blue curve). Note that a video animation of these acoustic waves is presented in the supplementary materials, which shows propagation of the generated acoustic waves with the first and second bounces, as observed in seismic source 2.
Current usage metrics show cumulative count of Article Views (full-text article views including HTML views, PDF and ePub downloads, according to the available data) and Abstracts Views on Vision4Press platform.
Data correspond to usage on the plateform after 2015. The current usage metrics is available 48-96 hours after online publication and is updated daily on week days.
Initial download of the metrics may take a while.