Fig. 2.
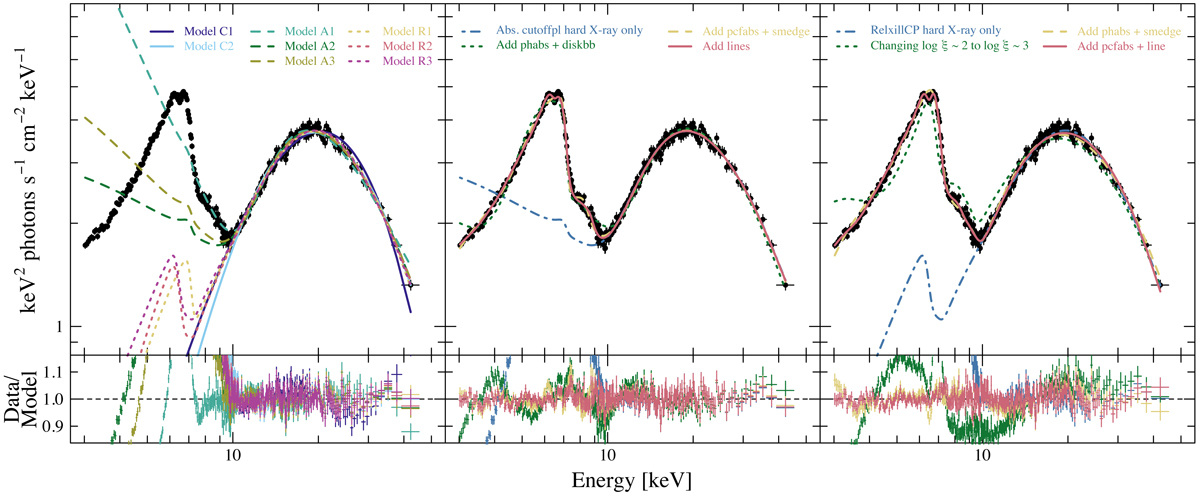
Initial modeling of the V404 Cyg preflare spectrum. Left: best-fit models fit to the hard X-ray data (10–79 keV), but plotted in the full data range. Different models are labeled, and the parameters are tabulated in Table 3. Solid lines refer to pure continuum models, dashed lines to absorbed continuum models, and dotted lines to reprocessed continuum models. Middle: fitting an absorbed cutoff power-law model to the full data range. The dot-dashed blue line corresponds to model A2 fit to the hard X-ray data (see left panel), the dotted green line corresponds to absorption and disk blackbody components added to the model, the dashed yellow line corresponds to partial absorption and smeared edge components added to the model, and the solid red line shows emission and absorption lines added to the model (parameters of the final model are tabulated in Table 4). See the text for more details. Right: fitting a reprocessed thermal Comptonization model to the full data range. The dot-dashed blue line corresponds to model R3 fit to the hard X-ray data (see the left panel), the dotted green line shows an increased value of the ionization parameter, the dashed yellow line corresponds to absorption and smeared edge components added to the model, and the solid red line shows partial absorption and an absorption line added to the model (parameters of the final model are tabulated in Table 4). See the text for more details.
Current usage metrics show cumulative count of Article Views (full-text article views including HTML views, PDF and ePub downloads, according to the available data) and Abstracts Views on Vision4Press platform.
Data correspond to usage on the plateform after 2015. The current usage metrics is available 48-96 hours after online publication and is updated daily on week days.
Initial download of the metrics may take a while.