Fig. 10.
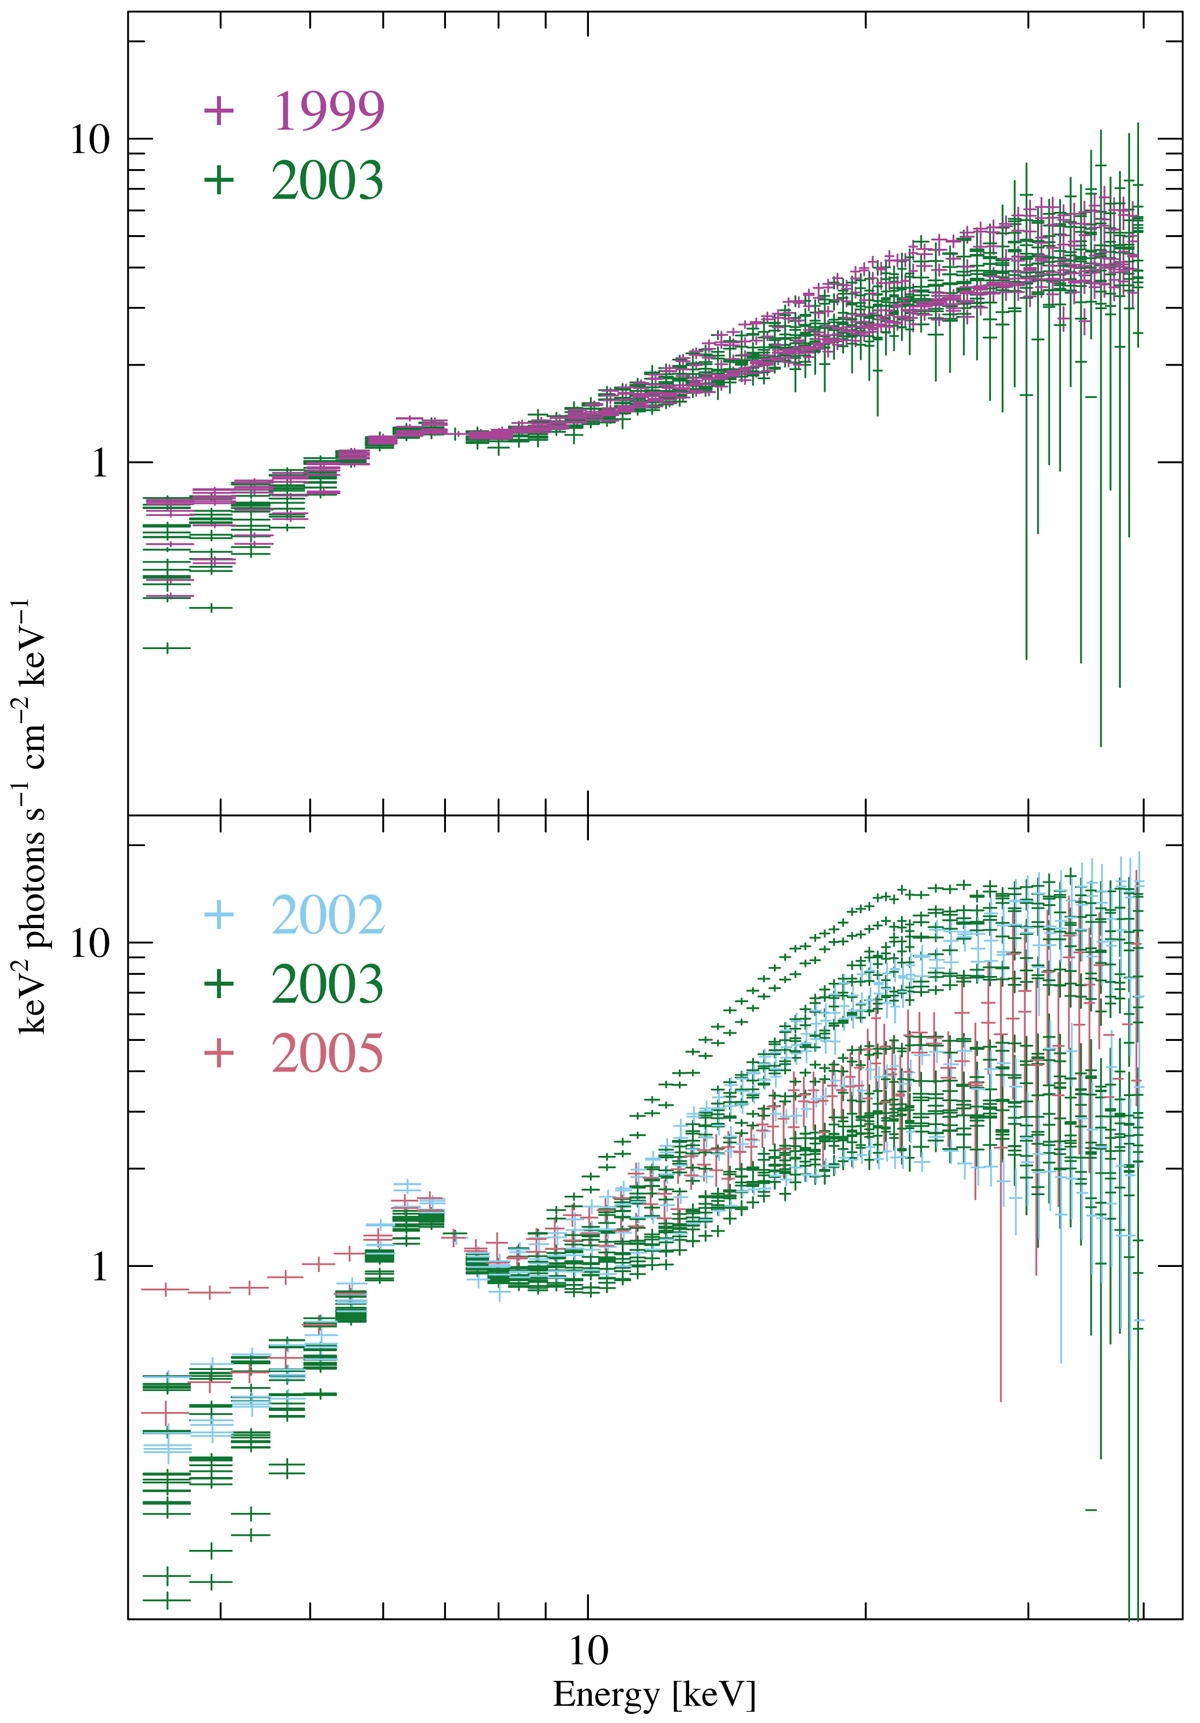
Changes in the RXTE/PCA spectral shape of V4641 Sgr during the outburst periods of 1999, 2002, 2003, and 2005. All the spectra have been normalized to the 7 keV flux in the first spectrum to show the difference in spectral shape. Top panel: outburst spectra reminiscent of the spectra with high count rate and low absorption of V404 Cyg (Walton et al. 2017), bottom panel: spectra reminiscent of the flaring spectra with lower count rate and higher absorption of V404 Cyg in Fig. 5.
Current usage metrics show cumulative count of Article Views (full-text article views including HTML views, PDF and ePub downloads, according to the available data) and Abstracts Views on Vision4Press platform.
Data correspond to usage on the plateform after 2015. The current usage metrics is available 48-96 hours after online publication and is updated daily on week days.
Initial download of the metrics may take a while.