Fig. 1.
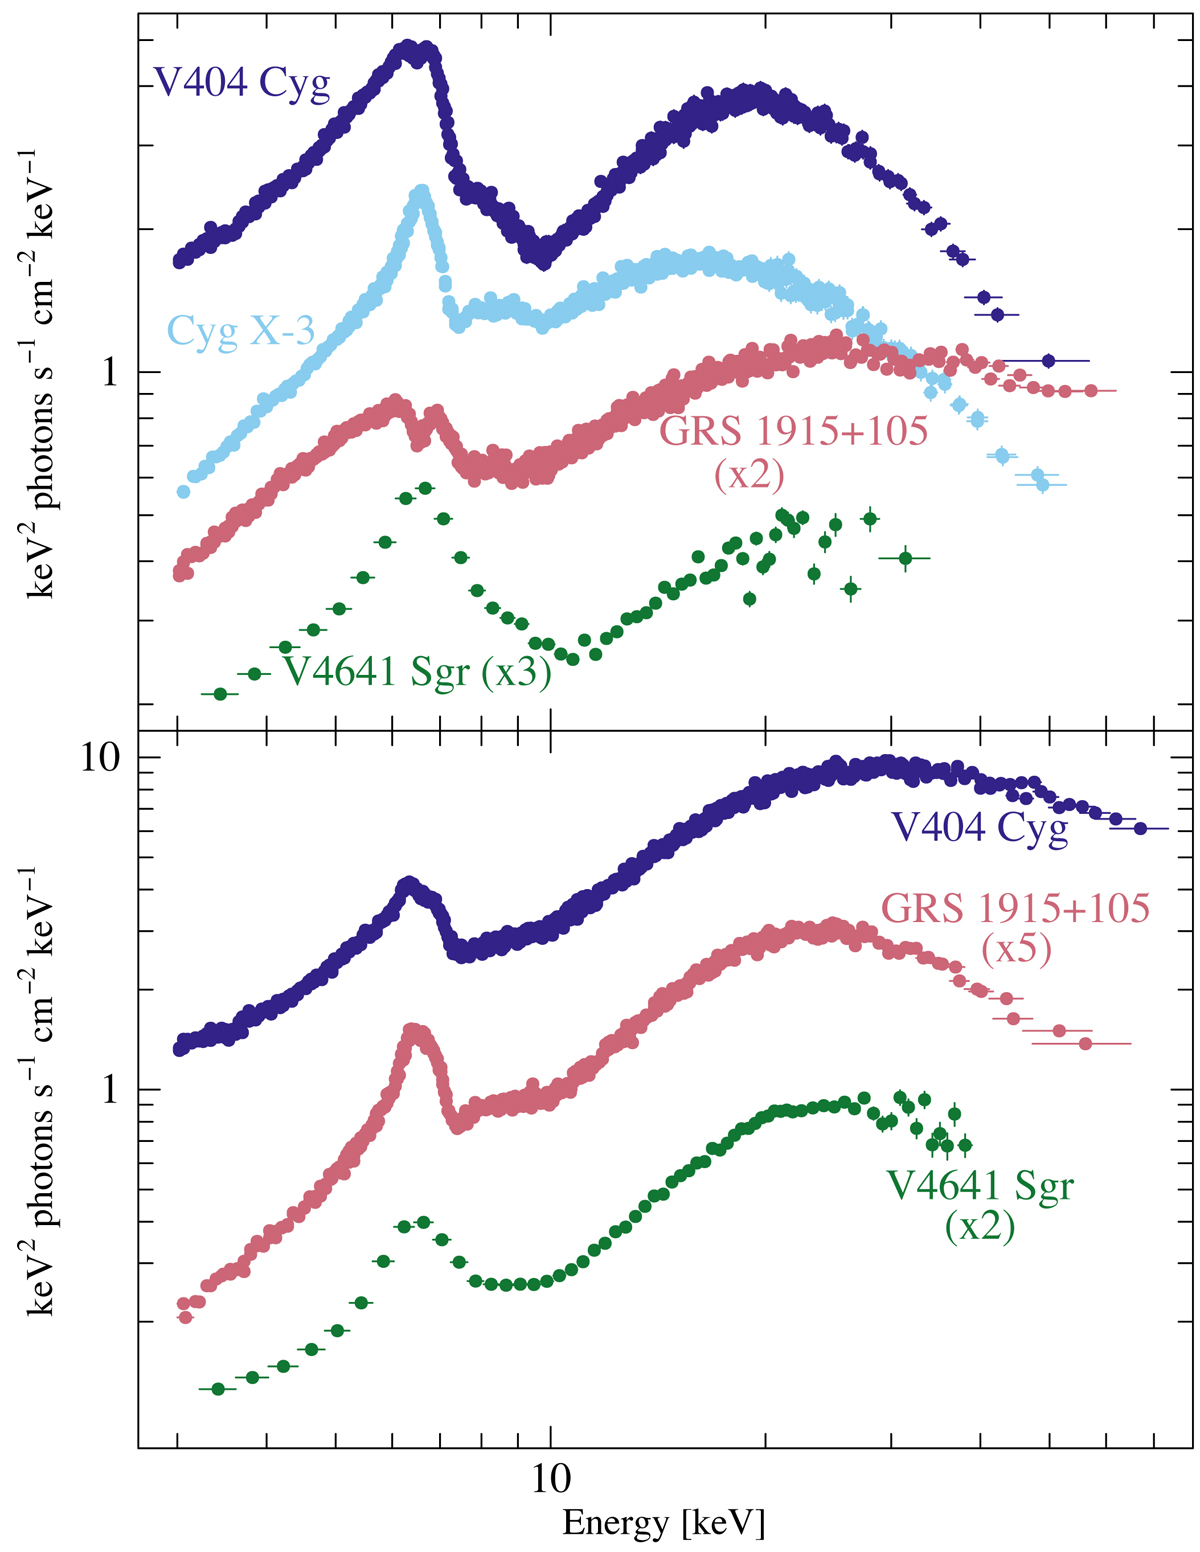
Collection of X-ray spectra from the four sources ordered into two panels according to their spectral shape. Top: NuSTAR spectra (FPMA/FPMB data both included) of V404 Cyg during the outburst period of 2015 (preceding intense X-ray flaring period), Cyg X–3 in the hard state, GRS 1915+105 during the anomalous low-luminosity state of 2019–2020 (preceding a period of sporadic X-ray and radio flaring), and the RXTE/PCA spectrum of V4641 Sgr during the outburst period of 2002. Bottom: NuSTAR spectra of V404 Cyg during the outburst period of 2015 (in between intense X-ray flaring), RXTE/PCA spectrum of V4641 Sgr during the outburst period of 2003, and NuSTAR spectra of GRS 1915+105 from the anomalous low-luminosity state (after the intense X-ray and radio flaring period). Note the spectral similarity between sources. The spectra of GRS 1915+105 and V4641 Sgr are renormalized by the amount shown for illustrative purposes.
Current usage metrics show cumulative count of Article Views (full-text article views including HTML views, PDF and ePub downloads, according to the available data) and Abstracts Views on Vision4Press platform.
Data correspond to usage on the plateform after 2015. The current usage metrics is available 48-96 hours after online publication and is updated daily on week days.
Initial download of the metrics may take a while.