Fig. A.2
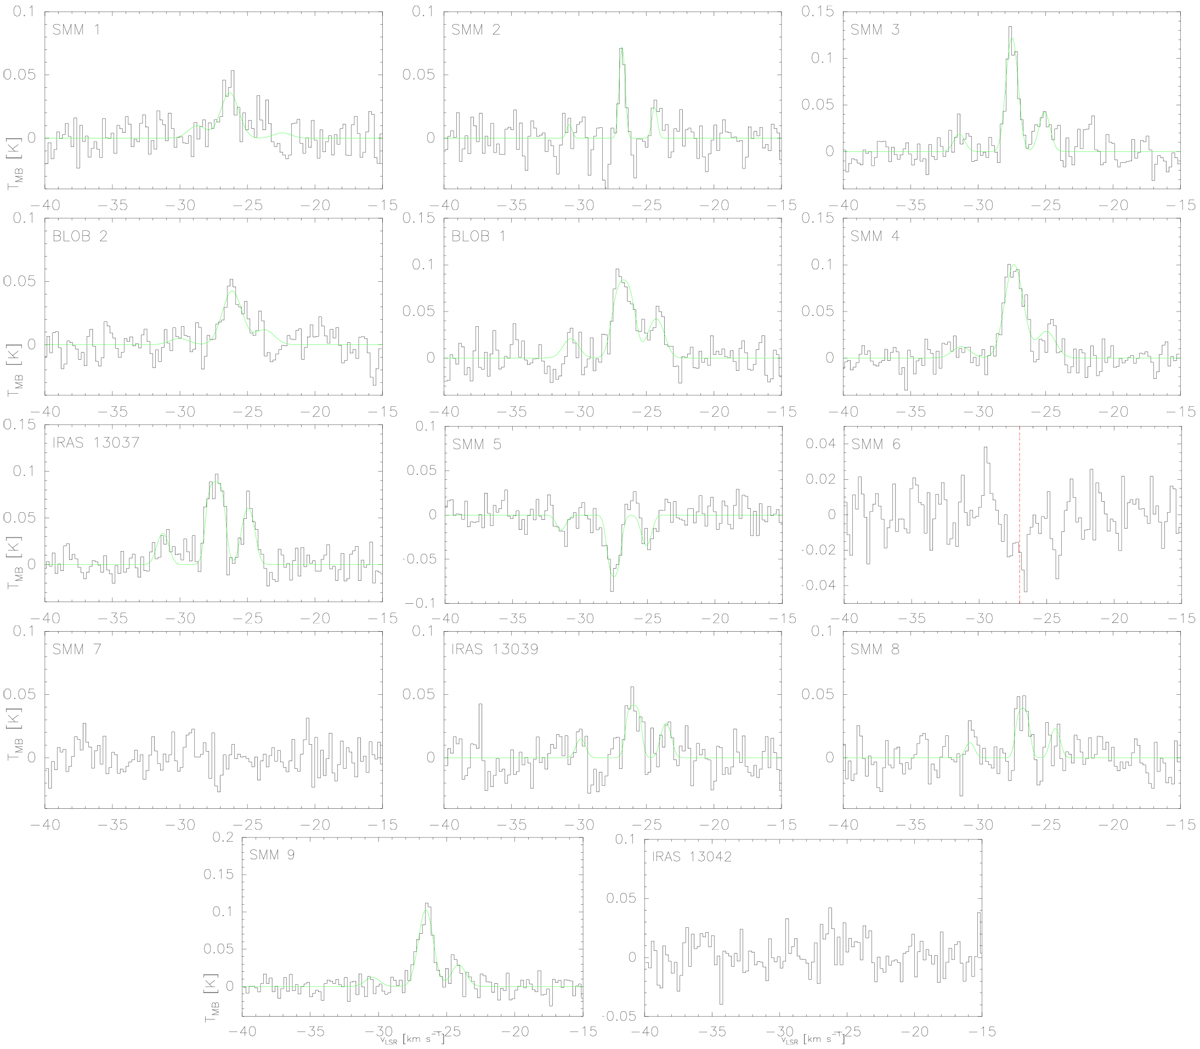
H13CN(2−1) spectra towards the Seahorse IRDC clumps. Hyperfine structure fits to the lines are overlaid in green. While the velocity range shown in each panel is the same, the intensity range is different to better show the line profiles. The H13CN line is seen in absoprtion towards SMM 5 (and a hint of it in SMM 6). The red, vertical dashed line in the SMM 6 panel shows the systemic velocity derived from C17O(J = 2−1) by Miettinen (2012).
Current usage metrics show cumulative count of Article Views (full-text article views including HTML views, PDF and ePub downloads, according to the available data) and Abstracts Views on Vision4Press platform.
Data correspond to usage on the plateform after 2015. The current usage metrics is available 48-96 hours after online publication and is updated daily on week days.
Initial download of the metrics may take a while.