Fig. 7
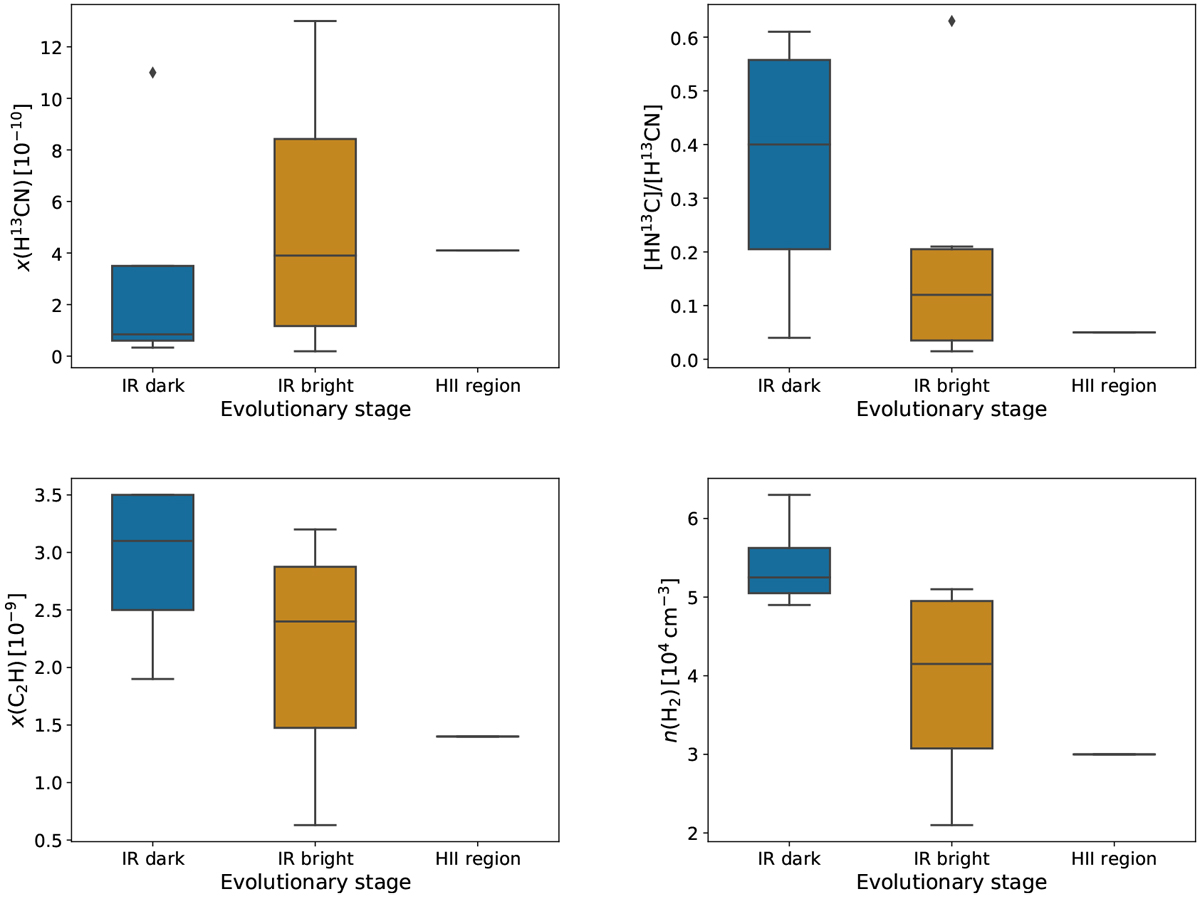
Box plots showing the clump properties that were found to be different on average for the different types of clumps in the present sample, namely clumps that are either dark or bright in the mid-IR and clumps associated with an H II region (onlyone source, IRAS 13039-6108). Censored data are not included in the plot. Some of the trends could be manifestations of clump evolution (Sect. 4.4).
Current usage metrics show cumulative count of Article Views (full-text article views including HTML views, PDF and ePub downloads, according to the available data) and Abstracts Views on Vision4Press platform.
Data correspond to usage on the plateform after 2015. The current usage metrics is available 48-96 hours after online publication and is updated daily on week days.
Initial download of the metrics may take a while.