Fig. 6
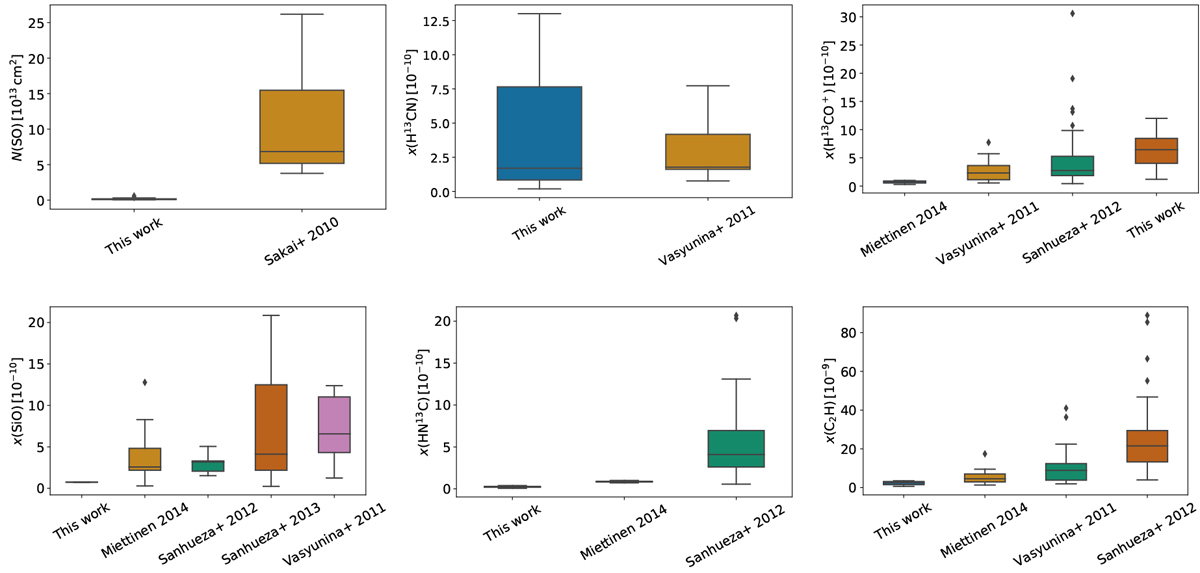
Comparison of the molecular abundance distributions (column density for SO) in the Seahorse IRDC with those in other IRDC sources presented in the literature. The box plots are sorted by increasing median abundance. The data points above some of the boxes represent outlier values. Upper limits are neglected from the distributions.
Current usage metrics show cumulative count of Article Views (full-text article views including HTML views, PDF and ePub downloads, according to the available data) and Abstracts Views on Vision4Press platform.
Data correspond to usage on the plateform after 2015. The current usage metrics is available 48-96 hours after online publication and is updated daily on week days.
Initial download of the metrics may take a while.