Free Access
Fig. 4
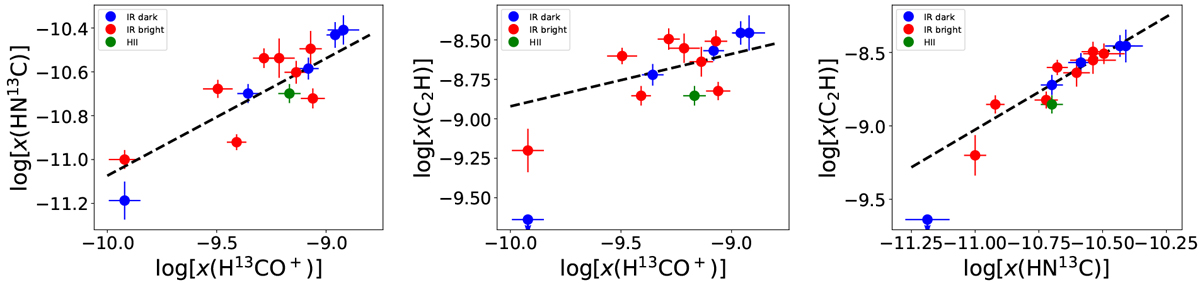
Scatter plots between the variables that were found to be linearly correlated with a Pearson correlation coefficient of r > 0.7. The arrows pointing down indicate upper limits. The dashed lines show the linear regression fits to the uncensored data points (i.e. the upper limits were not taken into account).
Current usage metrics show cumulative count of Article Views (full-text article views including HTML views, PDF and ePub downloads, according to the available data) and Abstracts Views on Vision4Press platform.
Data correspond to usage on the plateform after 2015. The current usage metrics is available 48-96 hours after online publication and is updated daily on week days.
Initial download of the metrics may take a while.