Fig. 3
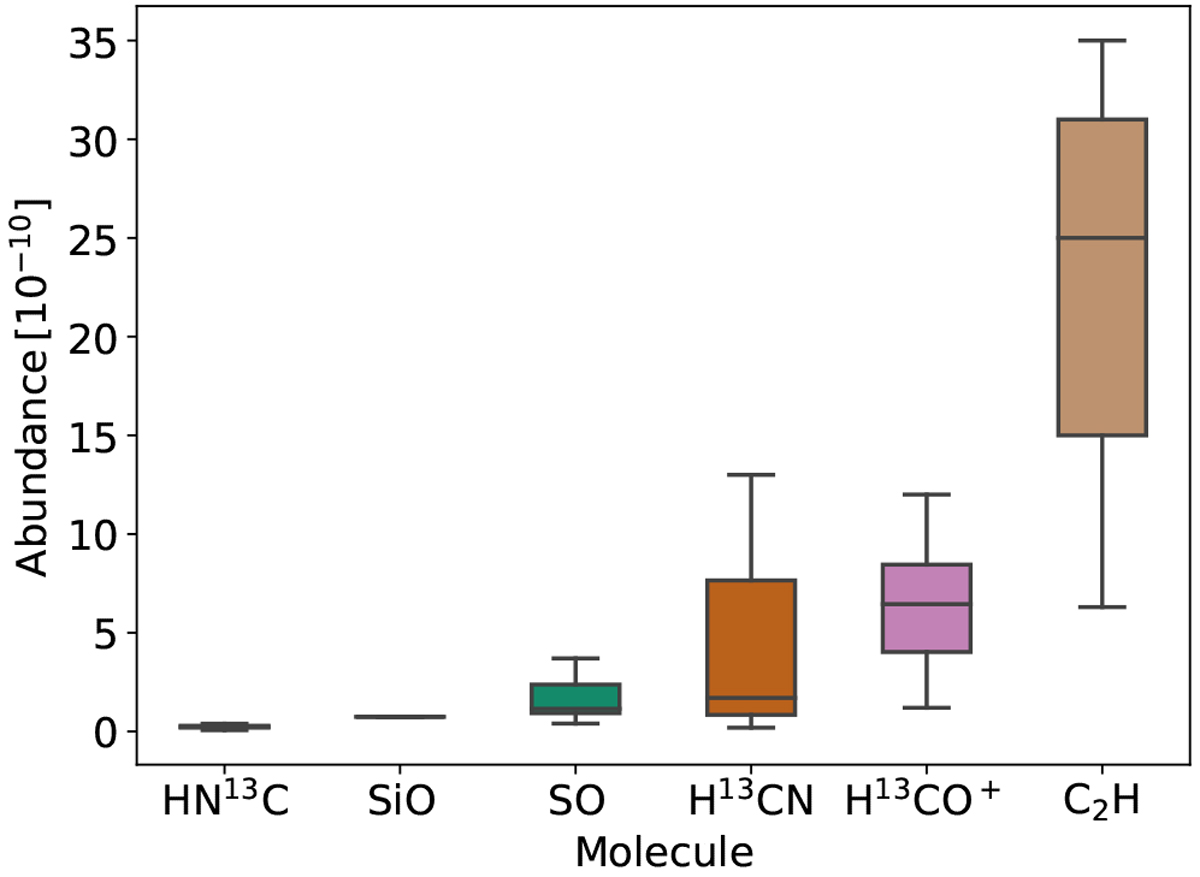
Box plot (or box-and-whisker plot) showing the distributions of the derived molecular fractional abundances. The boxes are arranged in ascending order according to the median value. The height of the box represents the interquartile range IQR ≡ [Q1, Q3] (i.e. from the 25th to 75th percentile). A horizontal line that goes through the box shows the median abundance (Q2 or the 50th percentile). The whiskers are defined to extend from Q1 − 1.5 ×IQR to Q3 +1.5 ×IQR unless the minimum and maximum values of the distribution are encountered before that (in which case the whiskers extend to the minimum and maximum values). We note that only the uncensored data are used to plot the distributions (i.e. the upper limits are ignored), and SiO was detected in only one of the target sources (SMM 3).
Current usage metrics show cumulative count of Article Views (full-text article views including HTML views, PDF and ePub downloads, according to the available data) and Abstracts Views on Vision4Press platform.
Data correspond to usage on the plateform after 2015. The current usage metrics is available 48-96 hours after online publication and is updated daily on week days.
Initial download of the metrics may take a while.