Fig. A.6
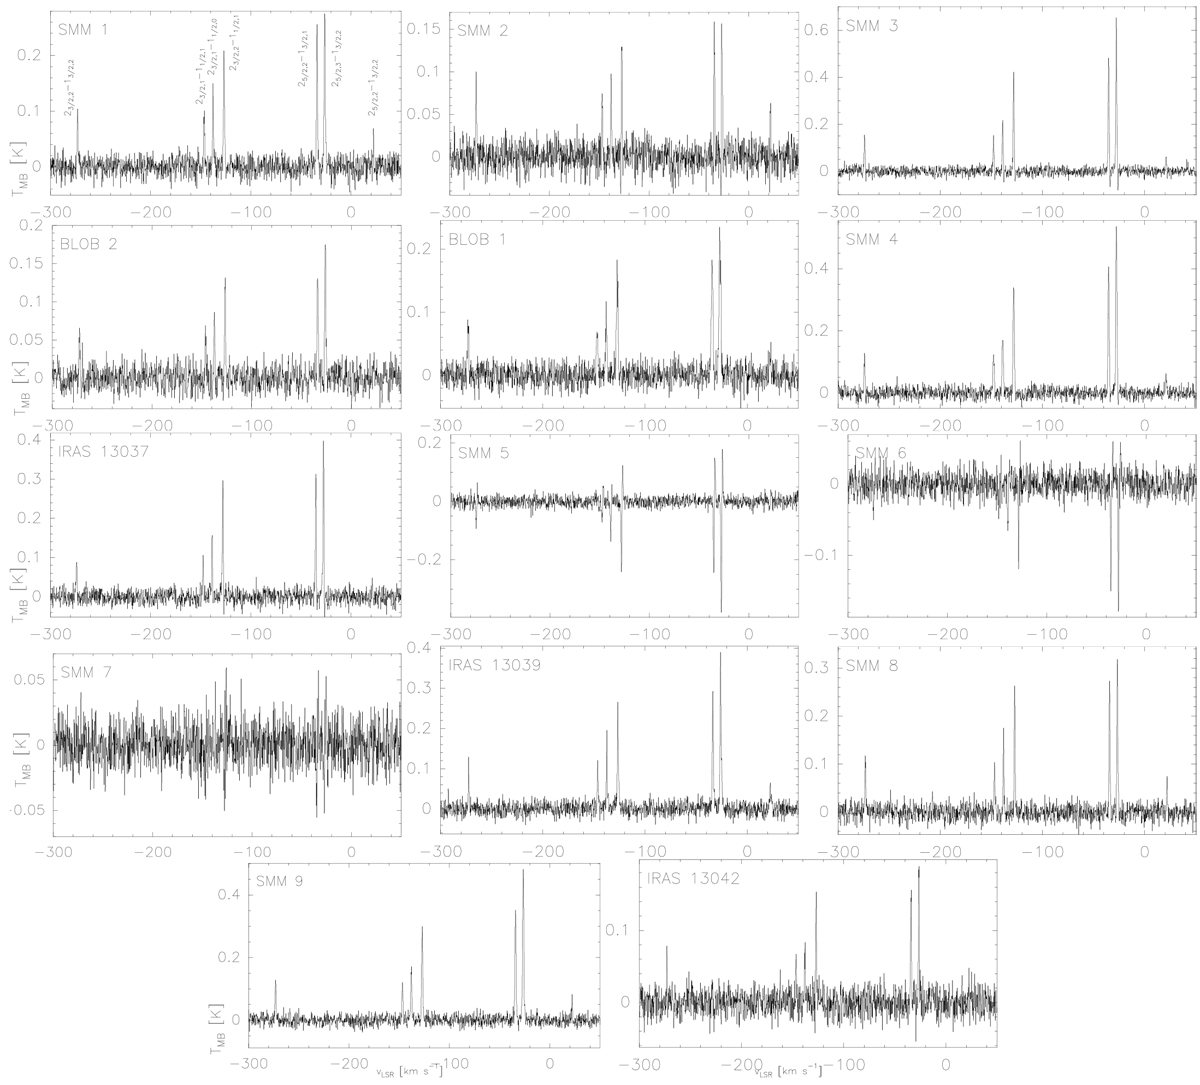
C2H(2−1) spectra towards the Seahorse IRDC clumps. The seven detected hyperfine components are labelled in the SMM 1 panel. The hyperfine structure fits to the lines are not shown to better see the detected lines. While the velocity range shown in each panel is the same (we note that it is much wider than in Figs. A.1–A.5), the intensity range is different to better show the detected lines. The C2 H lines are seen in absoprtion towards SMM 5 and 6 (also towards SMM 7 but not at our detection limit of ≥ 3σ).
Current usage metrics show cumulative count of Article Views (full-text article views including HTML views, PDF and ePub downloads, according to the available data) and Abstracts Views on Vision4Press platform.
Data correspond to usage on the plateform after 2015. The current usage metrics is available 48-96 hours after online publication and is updated daily on week days.
Initial download of the metrics may take a while.