Fig. 7.

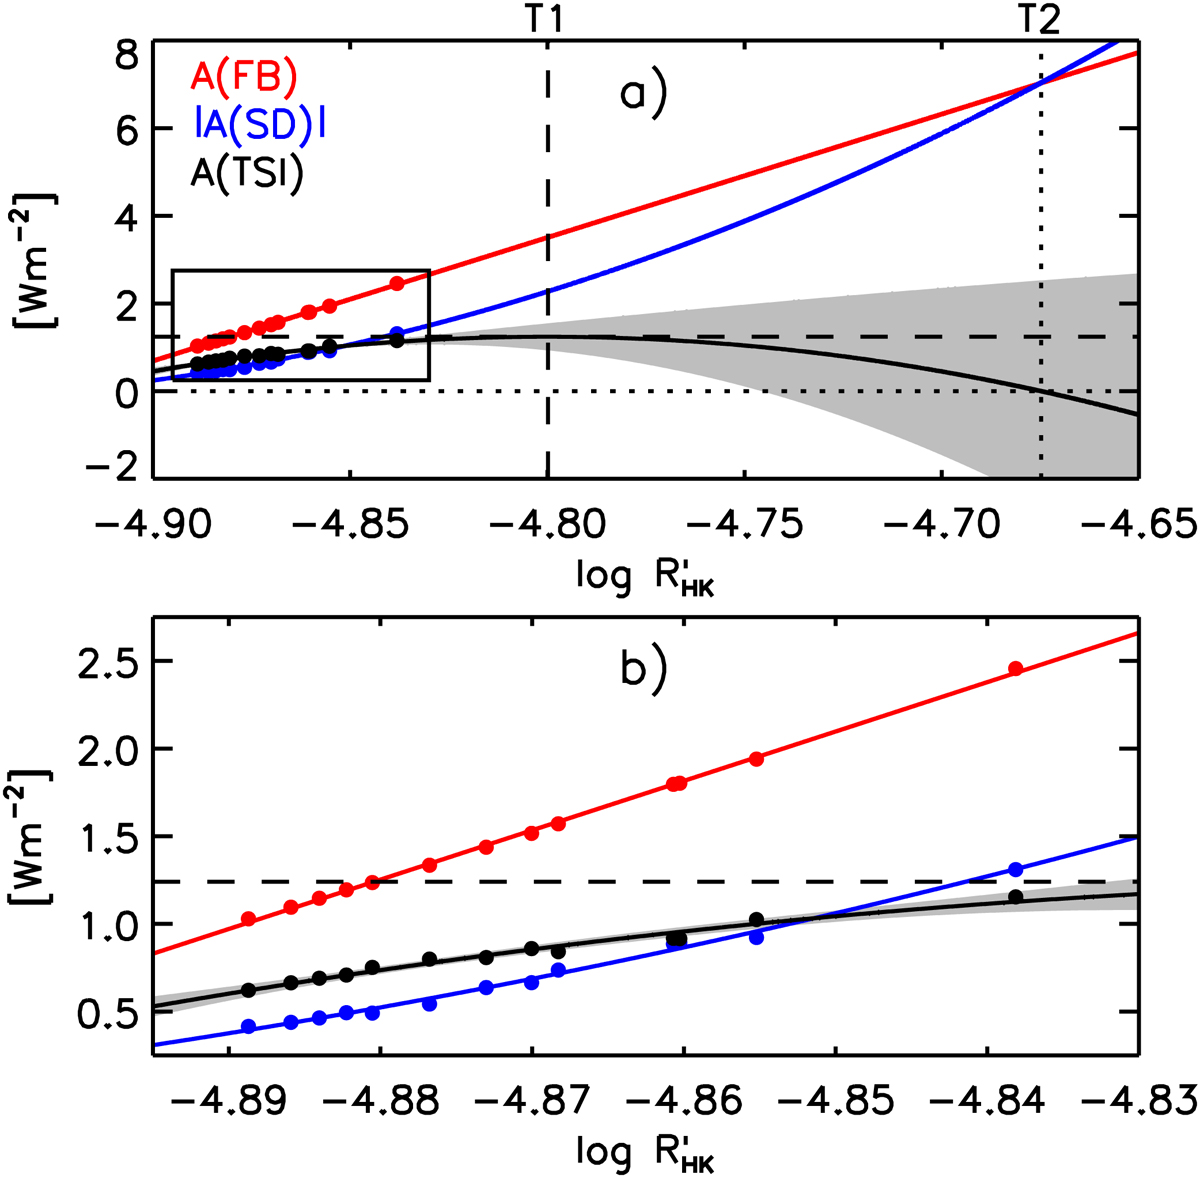
Cycle amplitude of FB (red plot points), SD (blue) and TSI (black), taken from Fig. 6, as a function of ![]() . The corresponding 1σ uncertainty, not drawn, is generally much smaller than the plot symbols. The red line follows the linear fit to A(FB) and the blue line the quadratic fit to |A(SD)|, while the black line indicates the corresponding A(TSI) level. The shaded region encloses the 95% confidence interval of the A(TSI) curve. The dashed lines mark the turning point of the A(TSI) curve and the dotted lines where it goes below zero, denoted T1 and T2, respectively. See Sect. 4.3 for the physical interpretation. The boxed area is blown up in the bottom panel.
. The corresponding 1σ uncertainty, not drawn, is generally much smaller than the plot symbols. The red line follows the linear fit to A(FB) and the blue line the quadratic fit to |A(SD)|, while the black line indicates the corresponding A(TSI) level. The shaded region encloses the 95% confidence interval of the A(TSI) curve. The dashed lines mark the turning point of the A(TSI) curve and the dotted lines where it goes below zero, denoted T1 and T2, respectively. See Sect. 4.3 for the physical interpretation. The boxed area is blown up in the bottom panel.
Current usage metrics show cumulative count of Article Views (full-text article views including HTML views, PDF and ePub downloads, according to the available data) and Abstracts Views on Vision4Press platform.
Data correspond to usage on the plateform after 2015. The current usage metrics is available 48-96 hours after online publication and is updated daily on week days.
Initial download of the metrics may take a while.


