Fig. 9
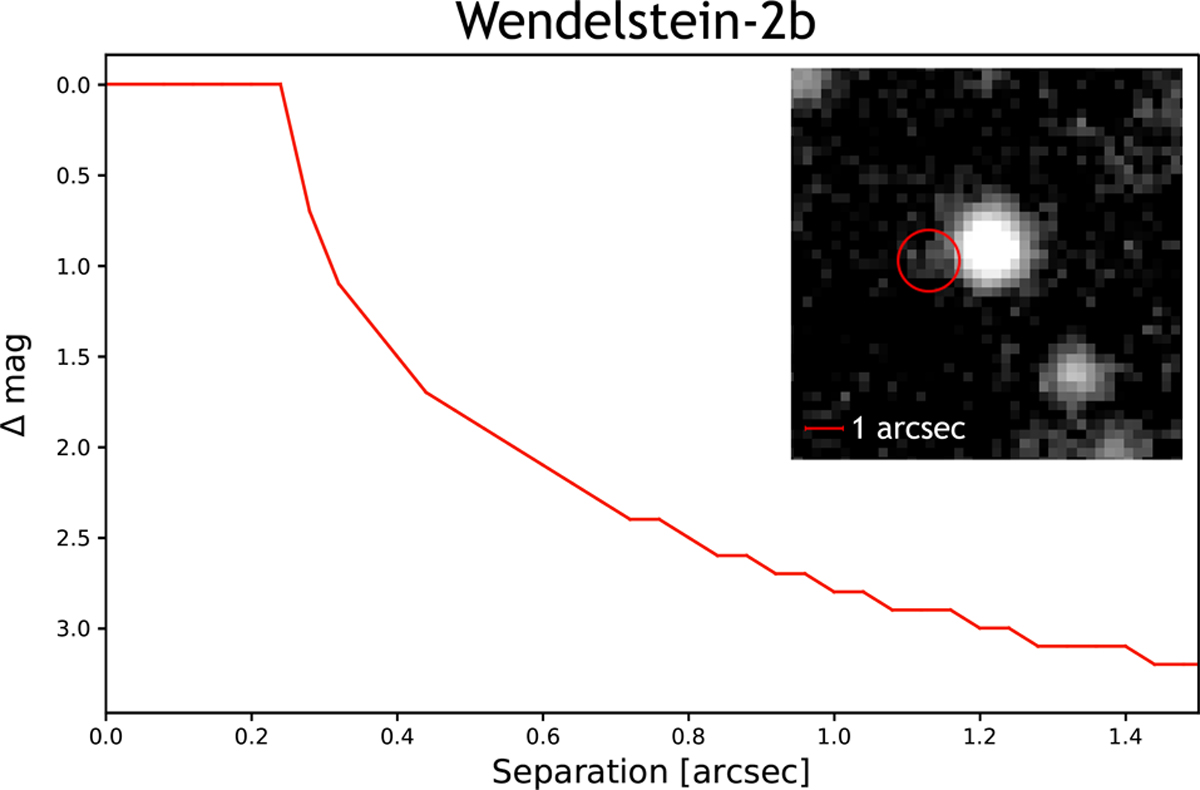
Contrast curve based on differential centroid measurements before and during Wendelstein-2b’s transit for the H band. An image cutout of the star is shown in the top right, extracted from a stacked reference frame that has an overall exposure time of 3438 s. The potential contaminant, identified in the Gaia survey, is marked by a red circle based on the given RA/Dec coordinates.
Current usage metrics show cumulative count of Article Views (full-text article views including HTML views, PDF and ePub downloads, according to the available data) and Abstracts Views on Vision4Press platform.
Data correspond to usage on the plateform after 2015. The current usage metrics is available 48-96 hours after online publication and is updated daily on week days.
Initial download of the metrics may take a while.