Fig. 5
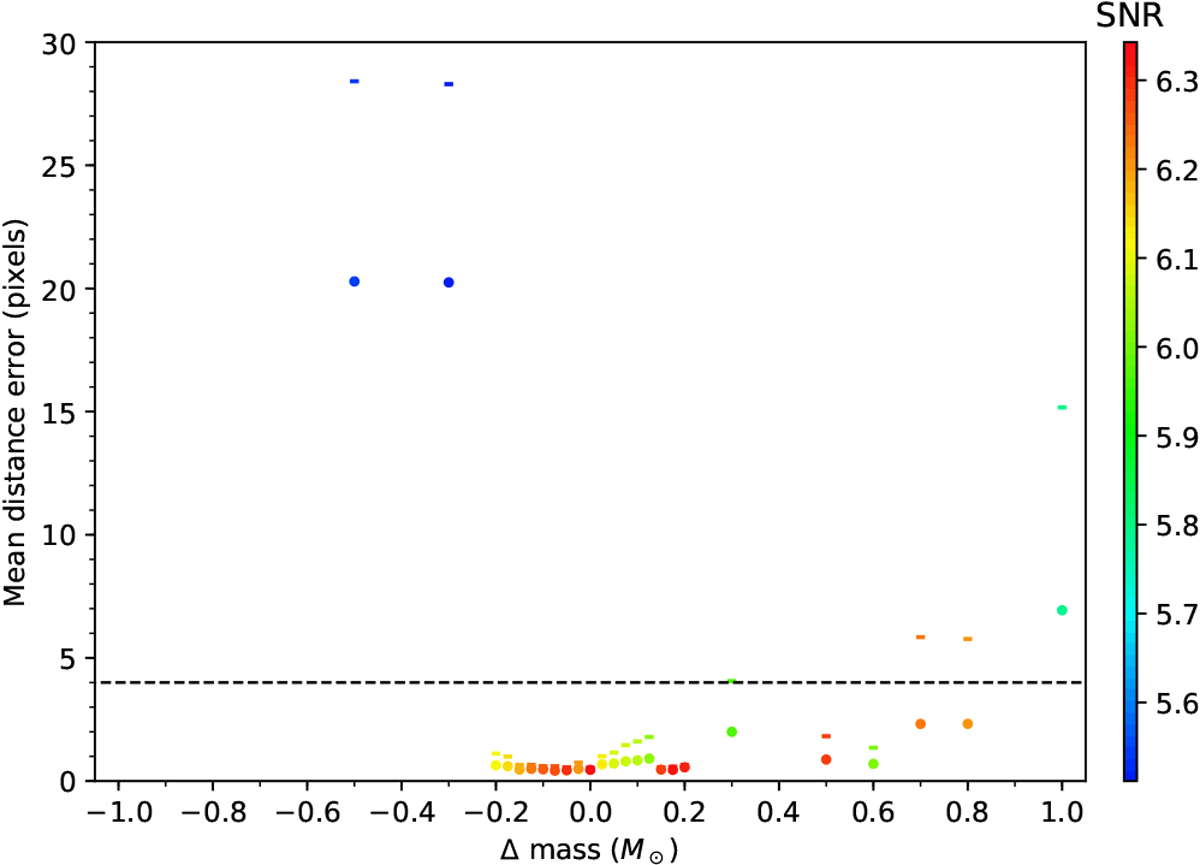
Results of the K-Stacker algorithm when including an error on the stellar mass used by the algorithm to calculate the orbital positions at each epoch. The dots (resp. dashes) show the mean (resp. maximum)distance between the true position and the position found by K-Stacker in all the images as a function of the error on the mass. These dots are color coded to indicate the corresponding (S/N)KS. The black dashed line indicates the size of the FWHM of the instrumental PSF (i.e., K-Stacker has missed the planet at least in one image when a small line is above the dashed line).
Current usage metrics show cumulative count of Article Views (full-text article views including HTML views, PDF and ePub downloads, according to the available data) and Abstracts Views on Vision4Press platform.
Data correspond to usage on the plateform after 2015. The current usage metrics is available 48-96 hours after online publication and is updated daily on week days.
Initial download of the metrics may take a while.