Fig. 10
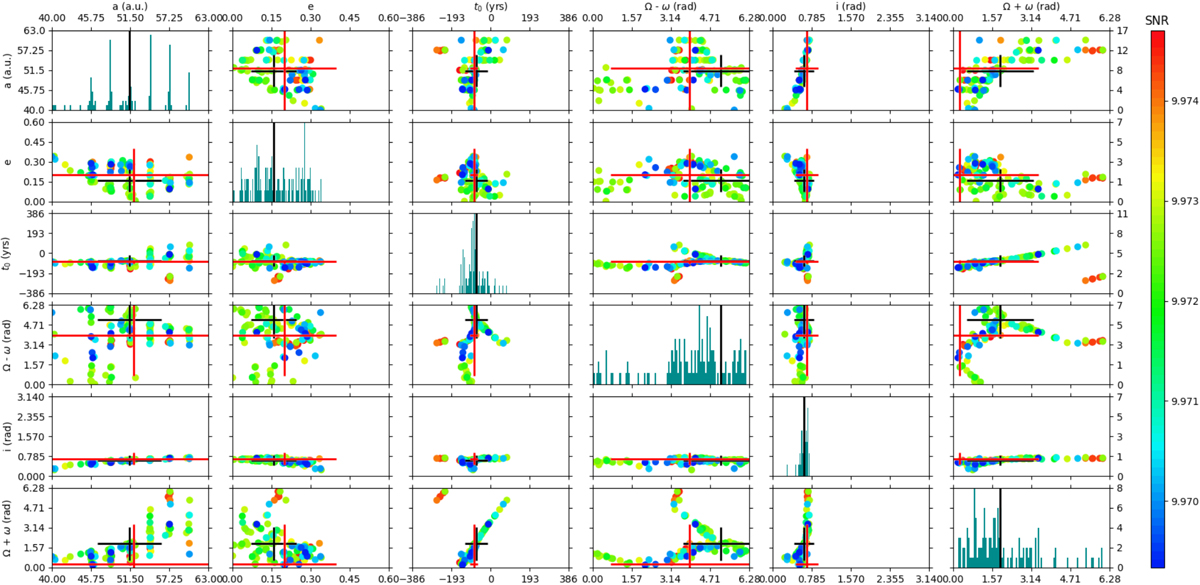
Histograms and 2D diagrams of the HD 95086 b orbital parameters found by K-Stacker. Left, top, and bottom: scale of the orbital parameters. Right: scale of the histograms. The 129 points in each 2D diagram correspond to the 129 orbits of the higher (S/N)KS found by K-Stacker. The color of each point gives the (S/N)KS indicated at right. The dark cross indicates the mean value of the orbital parameters with their error bars. The red cross shows the higher probability density found by an MCMC technique in Chauvin et al. (2018) converted in the K-Stacker referential. The origin of the t0 K-Stacker date is 05∕05∕2015.
Current usage metrics show cumulative count of Article Views (full-text article views including HTML views, PDF and ePub downloads, according to the available data) and Abstracts Views on Vision4Press platform.
Data correspond to usage on the plateform after 2015. The current usage metrics is available 48-96 hours after online publication and is updated daily on week days.
Initial download of the metrics may take a while.