Fig. A.2
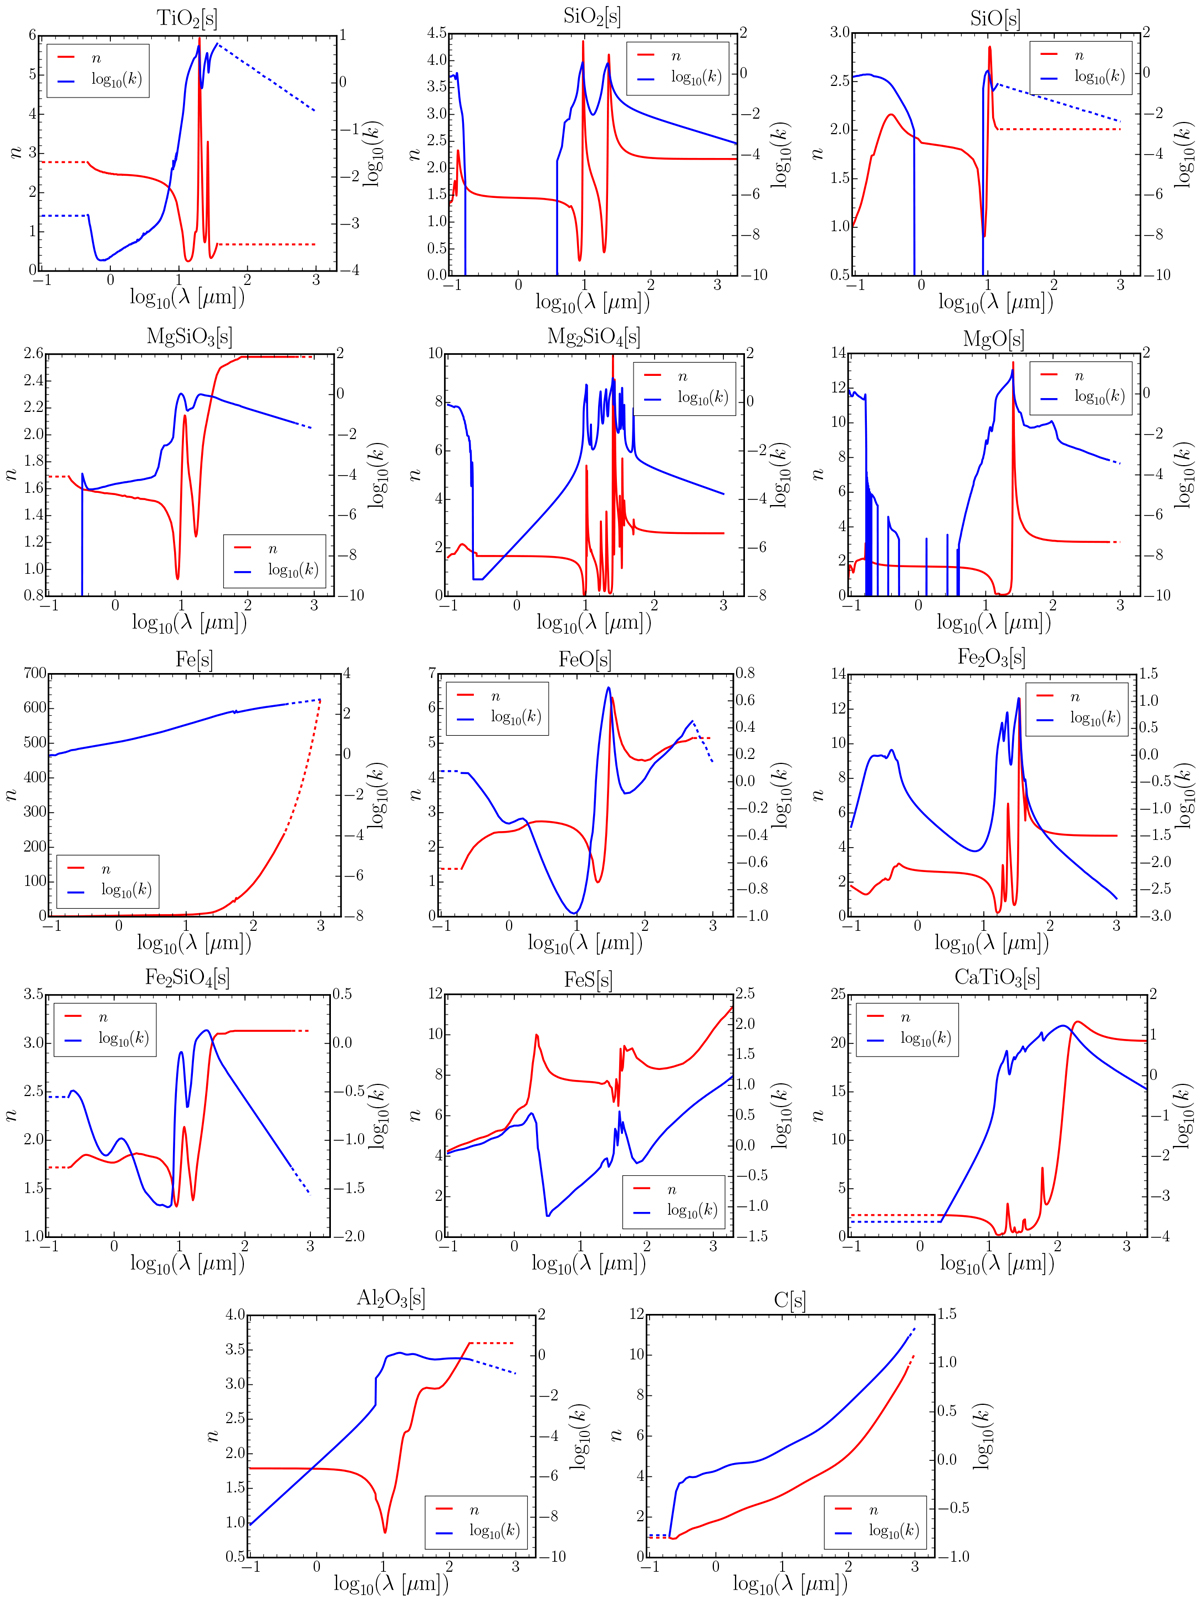
Real and imaginary refractive indexes (red and blue, respectively) for the condensate materials we used, shown across the wavelength range 0.1−1000 μm. Solid lines indicate regions for which reference data exist, and dashed lines indicate regions that were extrapolated. References for the refractive index data are found in Table A.1.
Current usage metrics show cumulative count of Article Views (full-text article views including HTML views, PDF and ePub downloads, according to the available data) and Abstracts Views on Vision4Press platform.
Data correspond to usage on the plateform after 2015. The current usage metrics is available 48-96 hours after online publication and is updated daily on week days.
Initial download of the metrics may take a while.