Fig. 7.
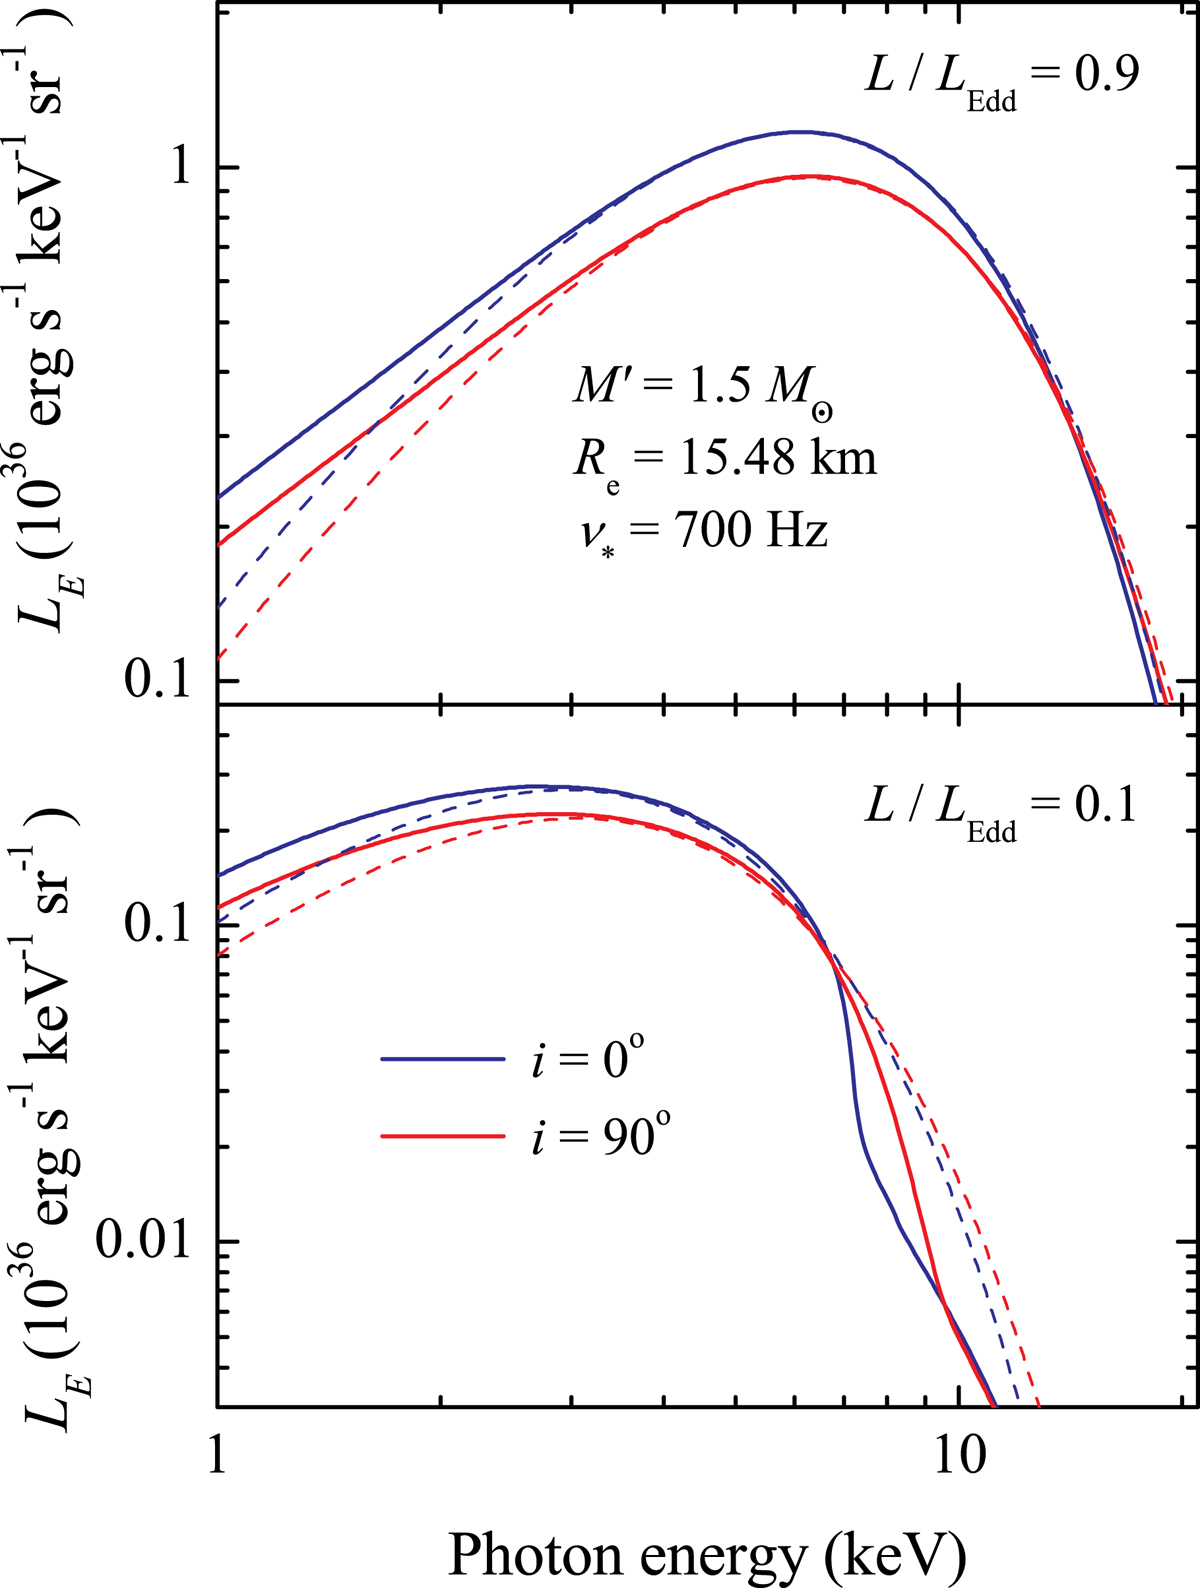
Spectra of the rotating NS with the parameters M′ = 1.519 M⊙, Re = 15.48 km, and ν* = 700 Hz computed for two inclination angles i= 0° (blue solid curve) and i= 90° (red solid curves), and for two relative luminosities (same over the surface) ℓ= 0.9 (top panel) and ℓ= 0.1 (bottom panel). The solid curves represent spectra computed taking accurate local spectra for atmosphere models from Suleimanov et al. (2012). The dashed curves correspond to the diluted blackbody approximation of the local spectra. Solar chemical composition of the atmosphere is assumed.
Current usage metrics show cumulative count of Article Views (full-text article views including HTML views, PDF and ePub downloads, according to the available data) and Abstracts Views on Vision4Press platform.
Data correspond to usage on the plateform after 2015. The current usage metrics is available 48-96 hours after online publication and is updated daily on week days.
Initial download of the metrics may take a while.