Fig. 12.
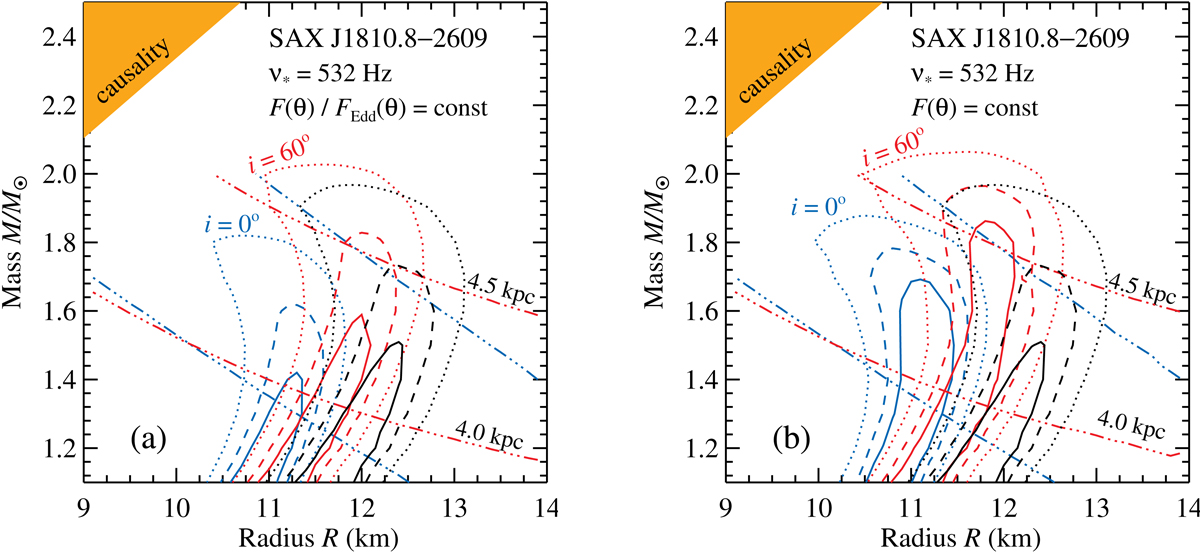
Confidence regions at the M–R plane for SAX J1810.8−2609 obtained from the χ2 map using the cooling tail method modified for rapid rotation. The solid, dashed, and dotted curves indicate the 68%, 90%, and 99% regions, respectively. The red contours correspond to the inclination i = 60°, while the blue contours are for the face-on NS. The black contours give the constraints assuming a non-rotating NS. (a) CRF case, i.e. constant relative flux. (b) CAF case, i.e. constant absolute flux. The triple dot-dashed curves are the contours of the constant distance of 4.0 and 4.5 kpc (distance is the only free parameter for a given pair of M and R).
Current usage metrics show cumulative count of Article Views (full-text article views including HTML views, PDF and ePub downloads, according to the available data) and Abstracts Views on Vision4Press platform.
Data correspond to usage on the plateform after 2015. The current usage metrics is available 48-96 hours after online publication and is updated daily on week days.
Initial download of the metrics may take a while.