Fig. 9
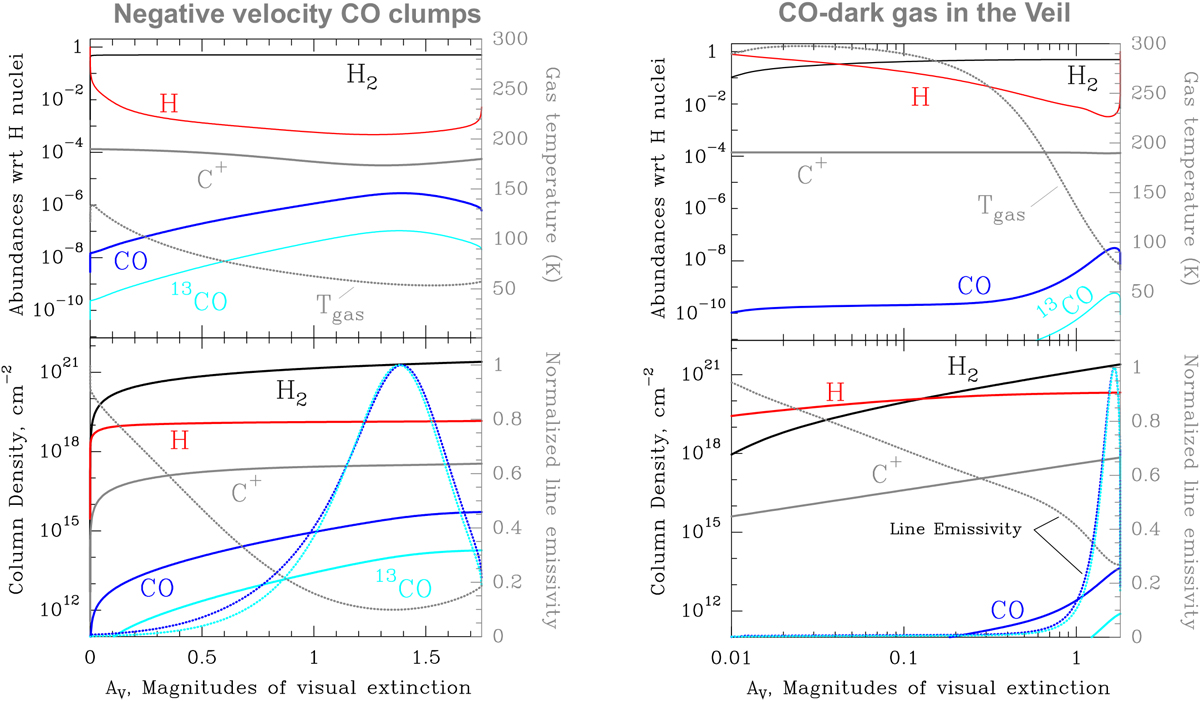
Profiles of predicted abundance, gas temperature, column density, and line emissivity (dotted curve) as a function of globule depth. Left panel: model that reproduces the observed [C II] 158 μm, 12CO and 13CO (2–1) line intensities toward the negative-vLSR CO globules (#1, #2, and #3). The FUV field is G0 = 40 and the gas density is nH = 2 × 104 cm−3. Right panel: model appropriate for a representative position of the shell where CO is not detected, with nH = 3 × 103 cm−3, G0 = 200, and AV = 1.8 (from Abel et al. 2019, and references therein).
Current usage metrics show cumulative count of Article Views (full-text article views including HTML views, PDF and ePub downloads, according to the available data) and Abstracts Views on Vision4Press platform.
Data correspond to usage on the plateform after 2015. The current usage metrics is available 48-96 hours after online publication and is updated daily on week days.
Initial download of the metrics may take a while.