Fig. 7
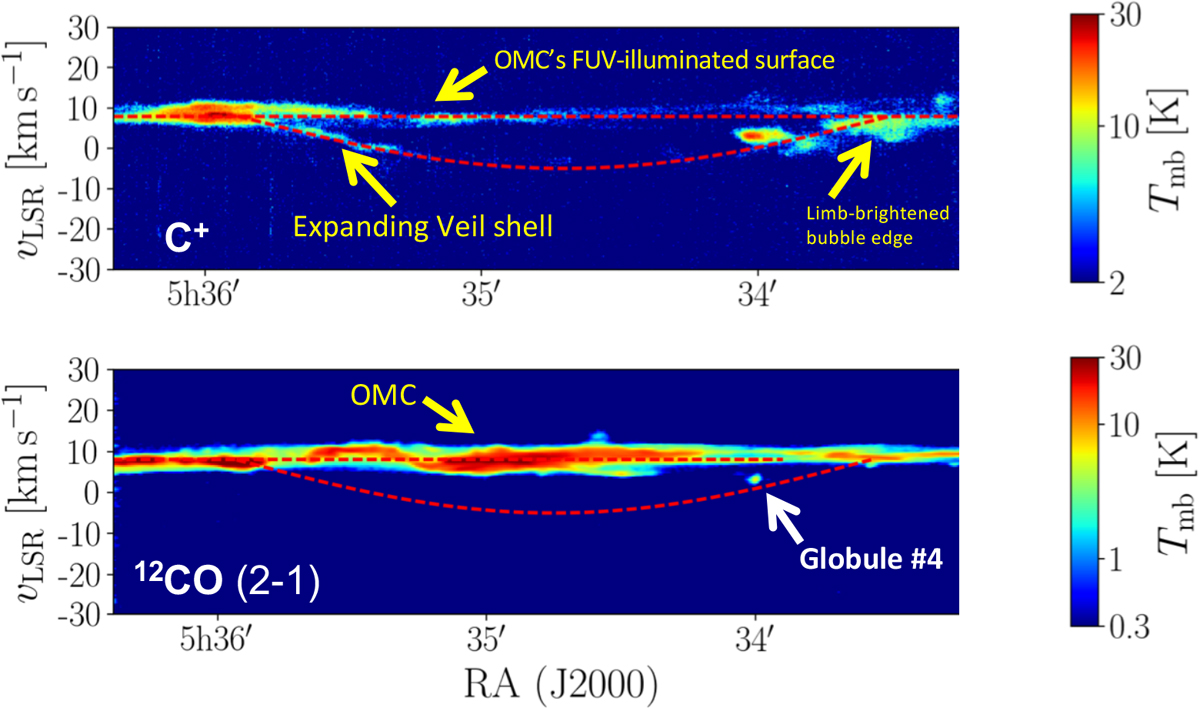
Position–velocity diagram of the [C II] 158 μm (upper panel) and CO (2–1) (lower panel) emission along an eastwest cut across the bubble at the declination of globule #4 (− 5°44′11.55″). We created this diagram by averaging spectra over a cut of 45″ wide in declination. A model of a half-shell expanding at 13 km s−1 is shown as a curved red dashed line (from Pabst et al. 2019). The bright emission at vLSR = +8 km s−1 (horizontal red dashed line) corresponds to the background dense molecular cloud and the integral-shape filament.
Current usage metrics show cumulative count of Article Views (full-text article views including HTML views, PDF and ePub downloads, according to the available data) and Abstracts Views on Vision4Press platform.
Data correspond to usage on the plateform after 2015. The current usage metrics is available 48-96 hours after online publication and is updated daily on week days.
Initial download of the metrics may take a while.