Fig. 6
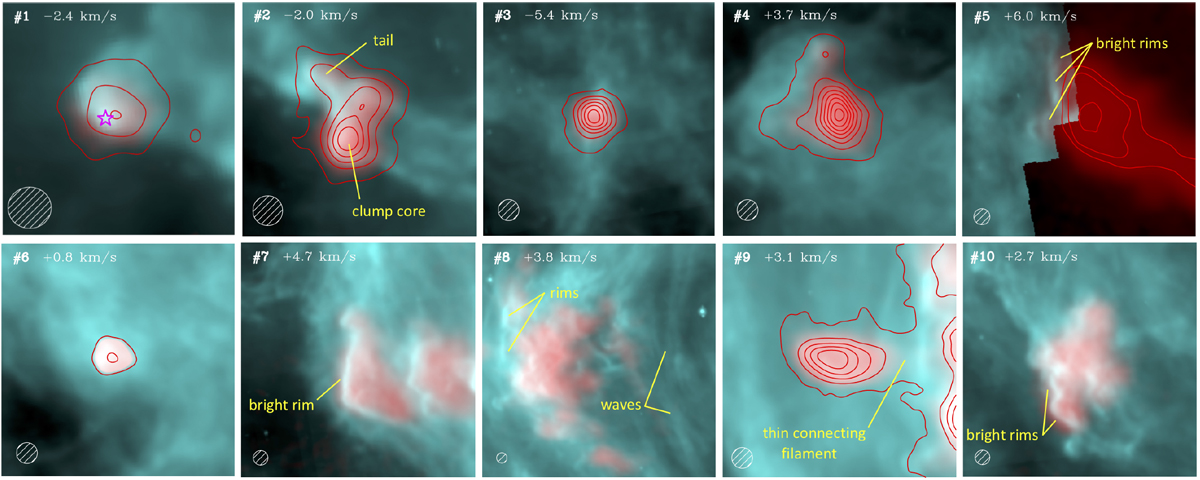
Gallery of blueshifted CO globules and emission structures detected toward Orion’s Veil bubble. The reddish color is the 12CO (2–1) emission integrated over the appropriate emission velocity range of each globule (spectra shown in Fig. 5). The bluish color is the 8 μm emission (extended PAH emission) imaged with Spitzer/IRAC at 2″ resolution. Each panel indicates the LSR velocity centroid of the CO line-profiles and a white-lined circle with the 11″ (~4500 AU) beam size of the CO observations. The images of the smaller CO globules display 12CO (2–1) intensity contours (in red) starting with the 5σ rms level (except for the brighter globules #5 and #9). In order to exhibit the bright rims (FUV-illuminated edges) of the larger and brighter CO globules, their images do not display CO emission contours (except for globule #5, where the contours help to locate the head of a more elongated structure). Globule #1 matches the position of YSO #1728 (magenta star, Megeath et al. 2012). Figure A.1 shows the same gallery but displaying the velocity-resolved [C II] 158 μm emission in bluish.
Current usage metrics show cumulative count of Article Views (full-text article views including HTML views, PDF and ePub downloads, according to the available data) and Abstracts Views on Vision4Press platform.
Data correspond to usage on the plateform after 2015. The current usage metrics is available 48-96 hours after online publication and is updated daily on week days.
Initial download of the metrics may take a while.