Fig. 5
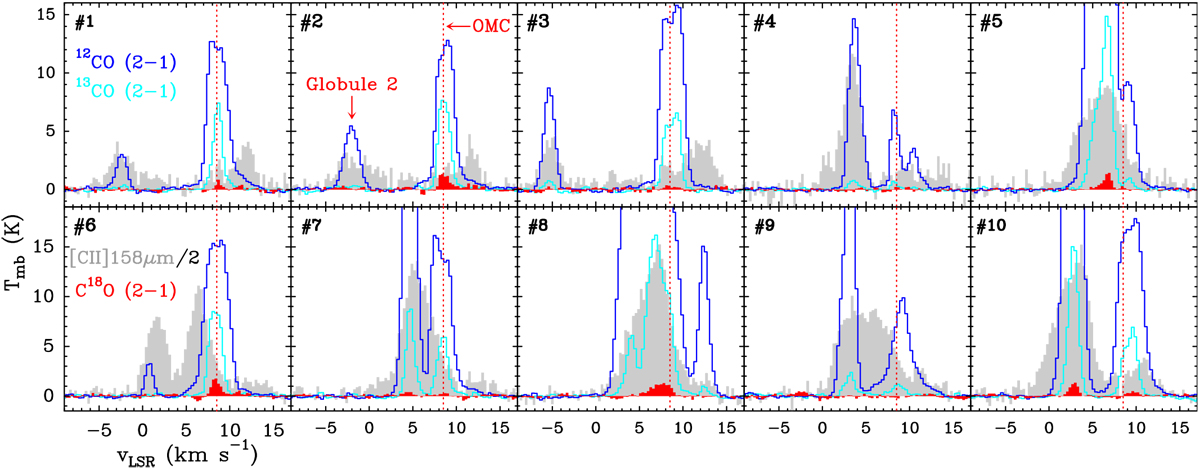
Velocity-resolved spectra toward the CO globules in Orion’s Veil. Each panel shows the [C II] 158 μm line (colored in gray), 12CO J = 2–1 (dark blue), 13CO J = 2–1 (cyan), and C18O J = 2–1 (red) lines toward the emission peak of each globule (labeled by symbol # as in Figs. 3 and 4). The x-axis represents the LSR velocity in km s−1. The vertical red dotted line marks the approximate velocity of the emission produced by OMC and associated star-forming molecular cloud located behind the Veil. All panels show emission features at velocities blueshifted from OMC. Globules #1, #2, and #3 represent the first detection of quiescent CO emission structures at negative LSR velocities in Orion.
Current usage metrics show cumulative count of Article Views (full-text article views including HTML views, PDF and ePub downloads, according to the available data) and Abstracts Views on Vision4Press platform.
Data correspond to usage on the plateform after 2015. The current usage metrics is available 48-96 hours after online publication and is updated daily on week days.
Initial download of the metrics may take a while.