Fig. 4
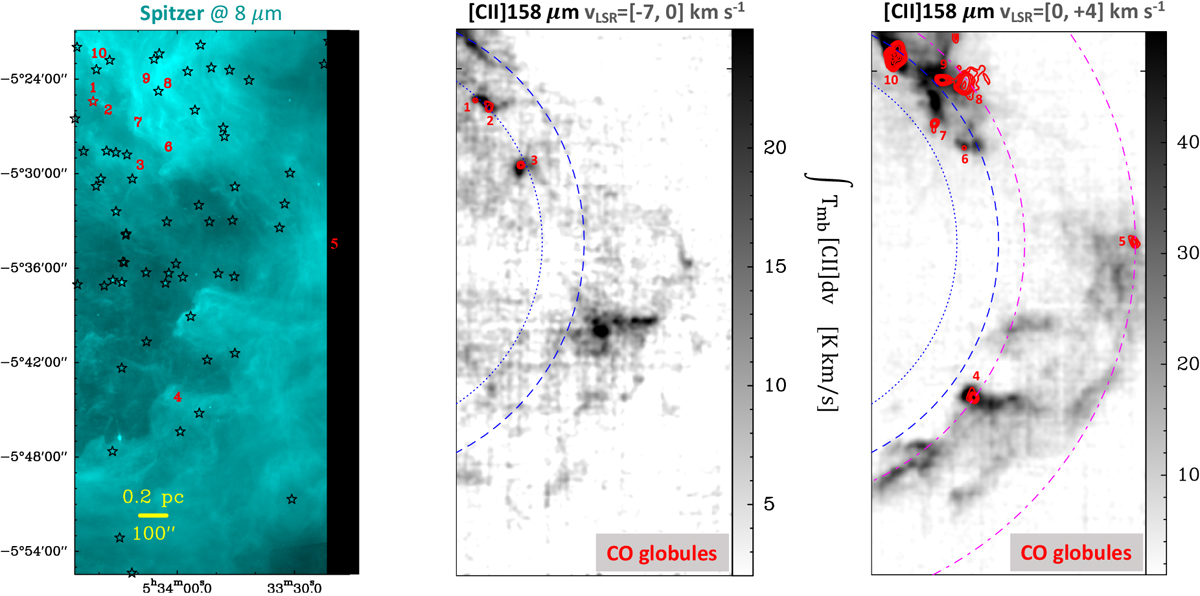
CO globules in the shell that encloses the Veil bubble. Left panel: Spitzer’s 8 μm image (2″ resolution). Numbers mark the position of the CO globules (shown in the middle and right panels). Stars show the position of YSOs detected in the field (Megeath et al. 2012, 2016). Globule #1 matches the position of YSO #1728 (red star). Middle panel: [C II] 158 μm emission at vLSR = −7 to 0 km s−1 (backgroundgrey image) and 12CO globules #1, #2 and #3 in the same velocity range (emission in red contours). Right panel: same as the middle panel but for the range vLSR = 0 to +4 km s−1. The arcs approximately represent the projection of concentric expanding rings in the shell (blue for rings closer to us).
Current usage metrics show cumulative count of Article Views (full-text article views including HTML views, PDF and ePub downloads, according to the available data) and Abstracts Views on Vision4Press platform.
Data correspond to usage on the plateform after 2015. The current usage metrics is available 48-96 hours after online publication and is updated daily on week days.
Initial download of the metrics may take a while.