Fig. 3
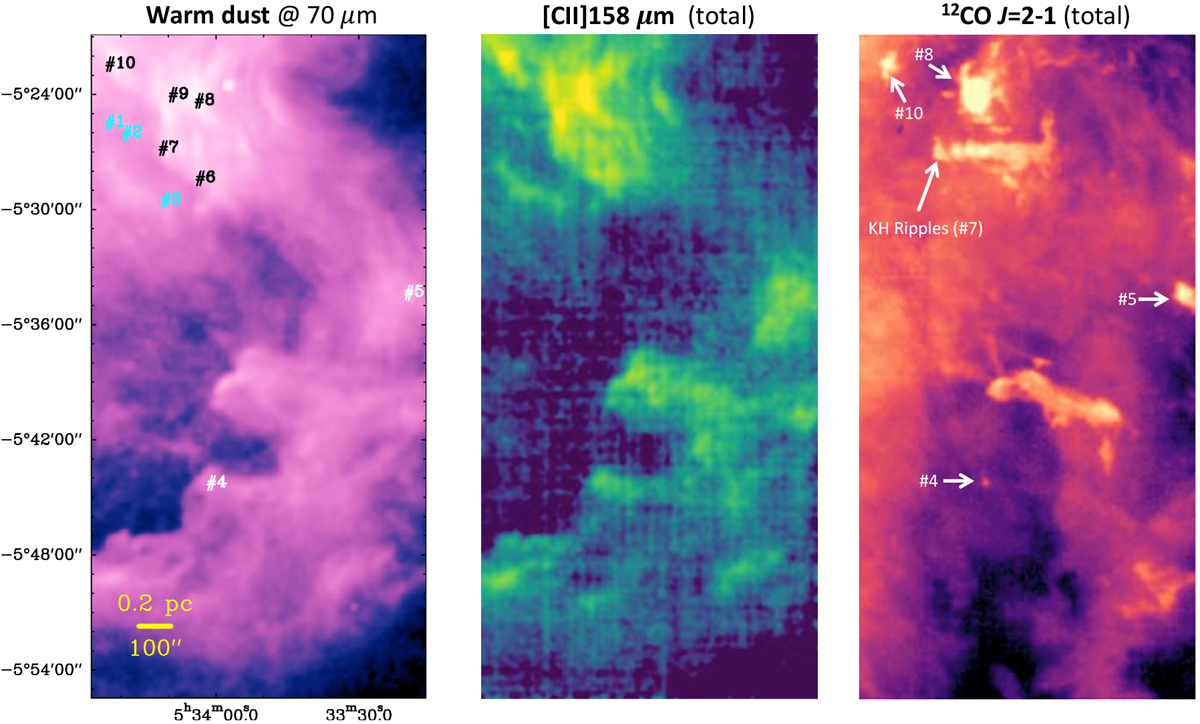
Zoom on the southwest region of the Veil shell. The first two images show the emission from FUV-heated warm dust and from C+. The rightmost image displays a rather different morphology, mostly dominated by extended CO from the molecular cloud behind the shell. Left panel: PACS 70 μm emission at 6″ resolution and positions of the detected CO globules. Middle panel: SOFIA [C II] 158 μm intensity map integrated in the vLSR = [−7, +20] km s−1 range (Pabst et al. 2019). Right panel: IRAM 30 m 12CO (2–1) intensity map in the vLSR = [−7, +20] km s−1 range. We identified blueshifted CO globules (some of them are labeled) with velocity centroids in the vLSR range [−7, +6] km s−1 (see Fig. 4).
Current usage metrics show cumulative count of Article Views (full-text article views including HTML views, PDF and ePub downloads, according to the available data) and Abstracts Views on Vision4Press platform.
Data correspond to usage on the plateform after 2015. The current usage metrics is available 48-96 hours after online publication and is updated daily on week days.
Initial download of the metrics may take a while.