Fig. A.11
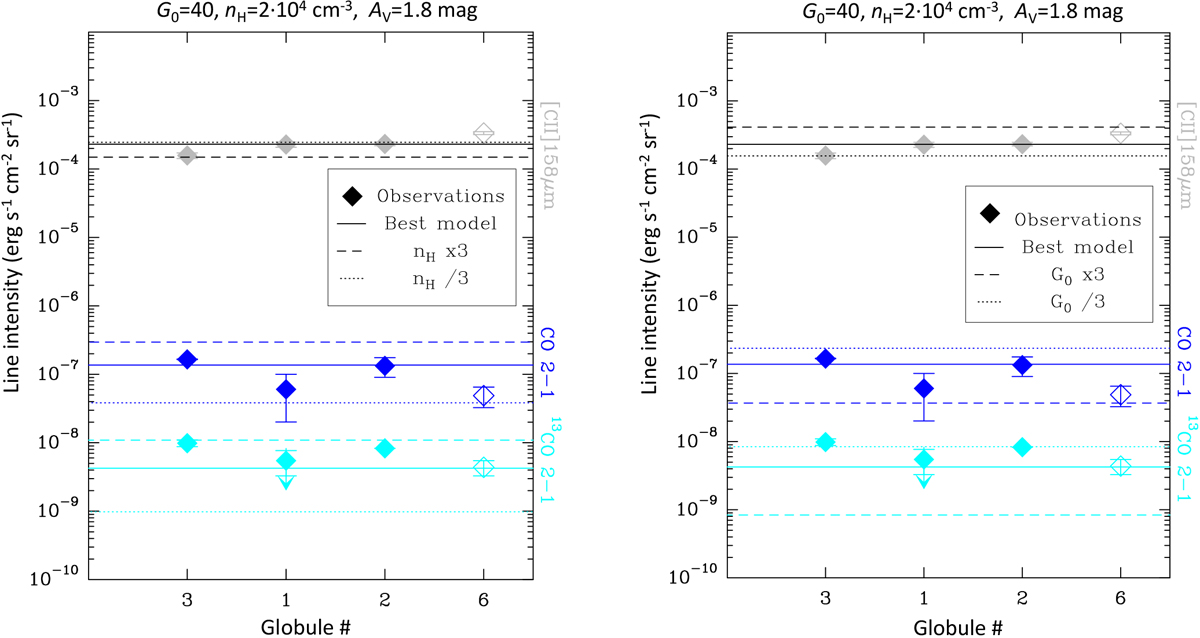
Comparison of PDR model predictions and observed line intensities from the negative-vLSR globules. Error bars show the 1σ uncertainty to the measured intensities obtained from a Gaussian fit to the observed lines. Globule #6 lies close in LSR velocity and shows similar emission properties to the negative-vLSR globules. The velocity centroid of each globule increases from left to right in the x-axis (see Fig. 5). Left panelshows variations in the gas density whereas the right panel shows variations in G0.
Current usage metrics show cumulative count of Article Views (full-text article views including HTML views, PDF and ePub downloads, according to the available data) and Abstracts Views on Vision4Press platform.
Data correspond to usage on the plateform after 2015. The current usage metrics is available 48-96 hours after online publication and is updated daily on week days.
Initial download of the metrics may take a while.