Fig. 10
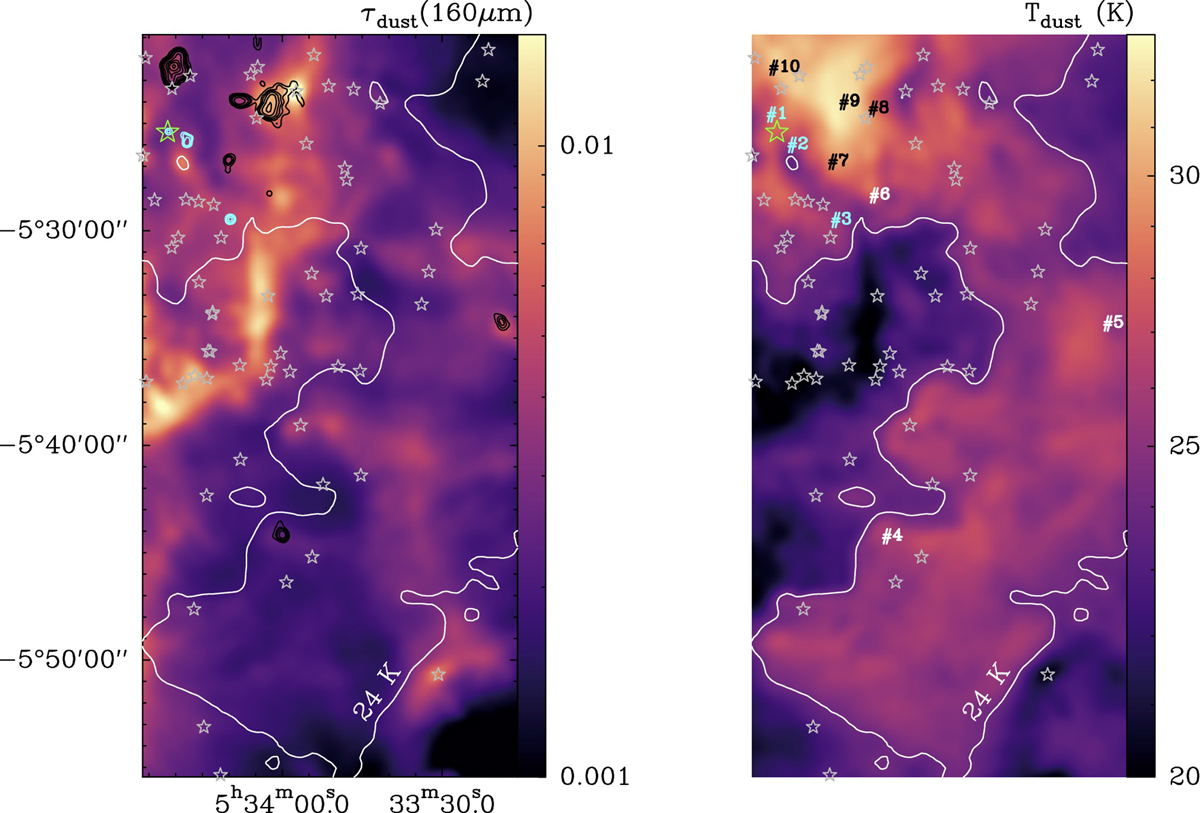
Dust opacity at 160 μm (left panel) and the dust temperature (right) computed by fitting modified blackbodies to the continuum emission measured by Herschel (Pabst et al. 2019). The white contour at Td = 24 K roughly encloses the expanding shell as observed in [C II] 158 μm and PAH emission. The lower-Td regions outside this area mostly arise from the background molecular cloud and not from the shell. Left panel: 12CO (2–1) emission from the globules in cyan (black) contours for the negative (positive) LSR velocities. Right panel: their labels. In both maps, the gray stars show the position (in the plane of the sky) of YSOs previously detected from infrared observations(Megeath et al. 2012, 2016). Only globule #1 matches the position of a YSO (object #1728) shown with a green star.
Current usage metrics show cumulative count of Article Views (full-text article views including HTML views, PDF and ePub downloads, according to the available data) and Abstracts Views on Vision4Press platform.
Data correspond to usage on the plateform after 2015. The current usage metrics is available 48-96 hours after online publication and is updated daily on week days.
Initial download of the metrics may take a while.