Fig. 1
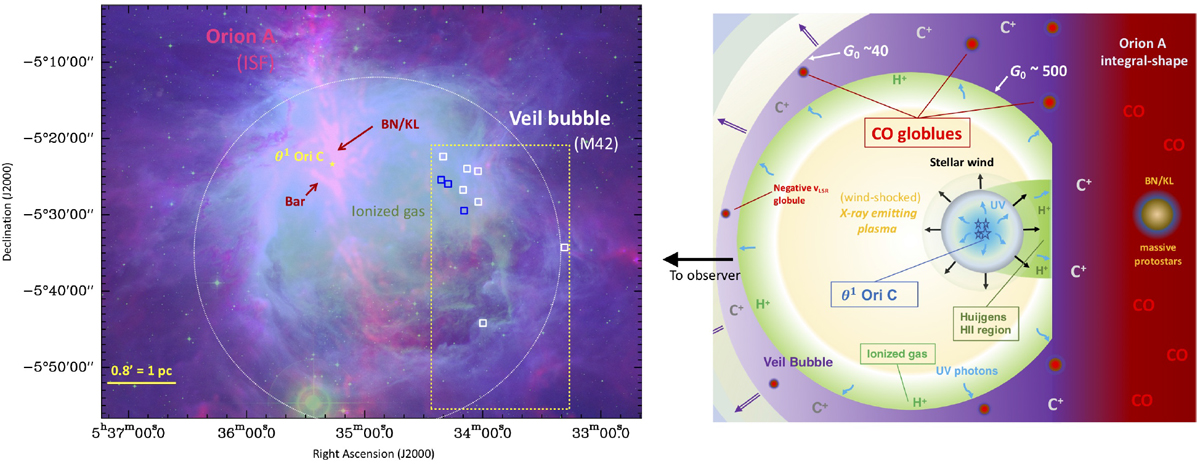
Left: extended Orion Nebula (M 42), part of the integral-shape filament in Orion A (reddish colors), and the Veil bubble (delineated by a dotted circle) filled with ionized gas (greenish). Red: SPIRE500 μm image (cold dust from the background molecular cloud). Blue: PACS 70 μm image (warm dust). Green: Hα image adapted from ESO’s Second Digitized Sky Survey (DSS2, see Pabst et al. 2020). The yellow star corresponds to the position of θ1 Ori C in the Trapezium cluster. Here we focus on the 17.5′× 34.5′ area enclosed by the dotted box. The blue and white squares mark the position of CO globules detected in the expanding shell that confines the bubble (blue squares for the negative-vLSR globules). Right: sketch of the region, not at scale, adapted from Pabst et al. (2019).
Current usage metrics show cumulative count of Article Views (full-text article views including HTML views, PDF and ePub downloads, according to the available data) and Abstracts Views on Vision4Press platform.
Data correspond to usage on the plateform after 2015. The current usage metrics is available 48-96 hours after online publication and is updated daily on week days.
Initial download of the metrics may take a while.