Fig. 5.
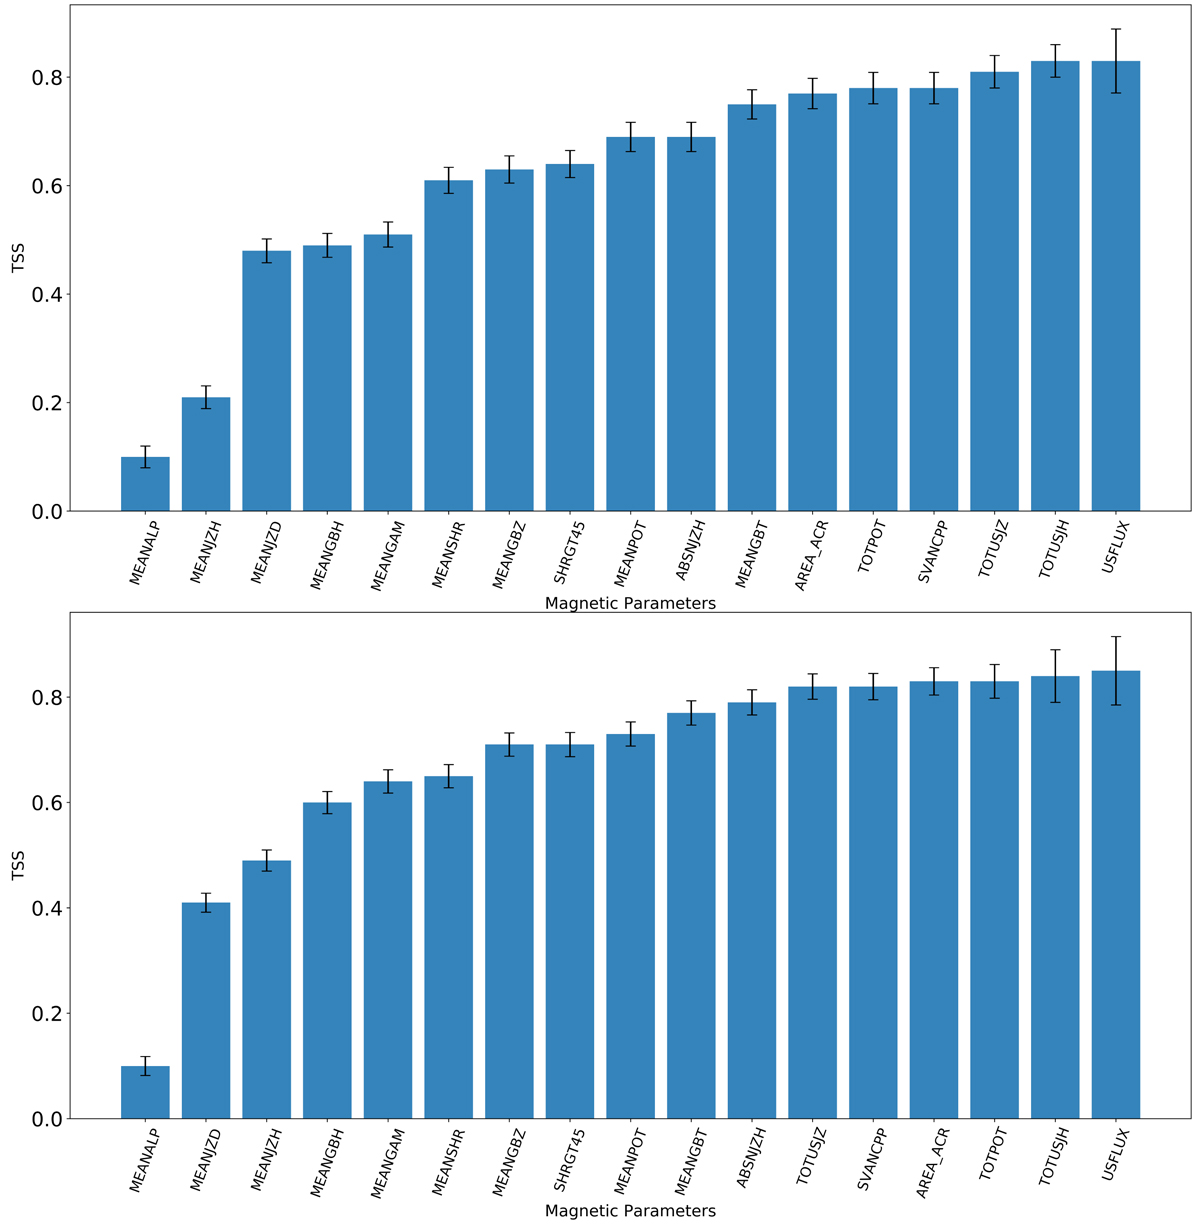
Top bar plot: distribution of TSS values after running the logistic regression (baseline) classifier on the summarized time series of individual active region parameters. Bottom bar plot: same, but for the support vector machine algorithm. This plots clearly show that the top few parameters, specifically, the total unsigned magnetic flux and the total unsigned magnetic helicity, have the best distinguishing capability.
Current usage metrics show cumulative count of Article Views (full-text article views including HTML views, PDF and ePub downloads, according to the available data) and Abstracts Views on Vision4Press platform.
Data correspond to usage on the plateform after 2015. The current usage metrics is available 48-96 hours after online publication and is updated daily on week days.
Initial download of the metrics may take a while.