Fig. D.1
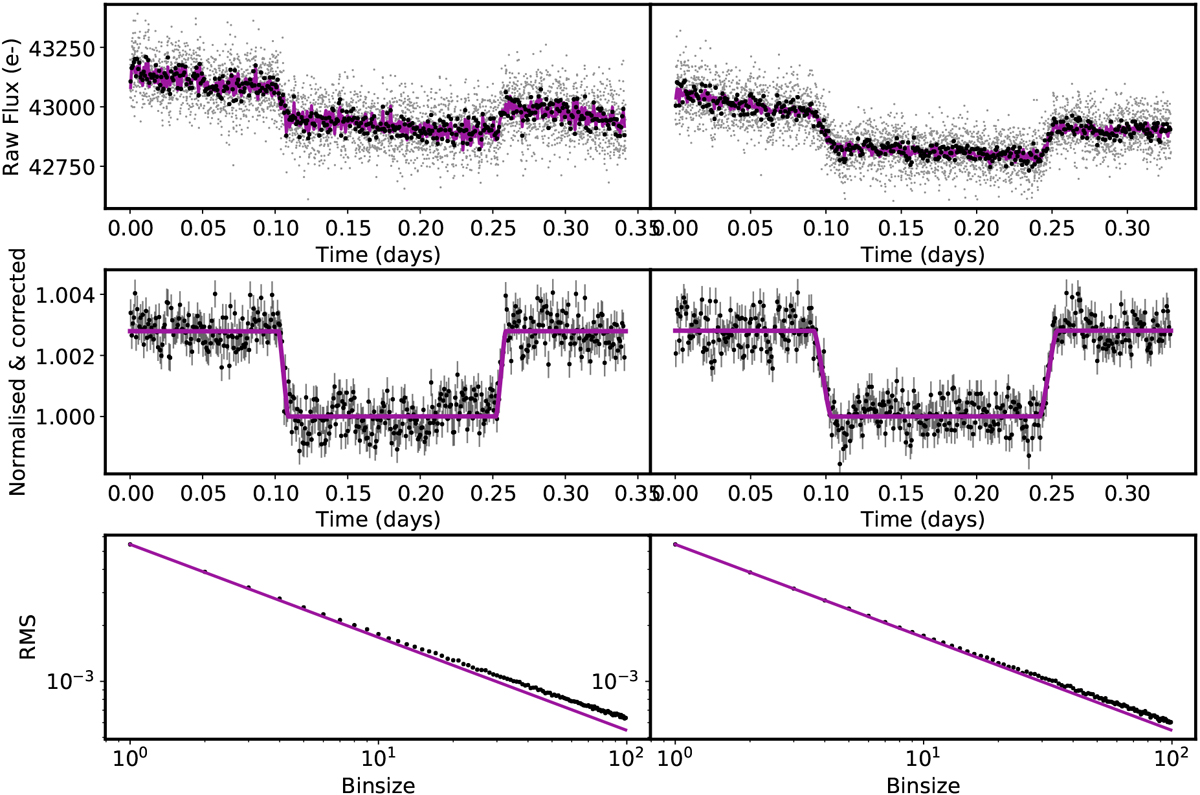
Eclipses of KELT-9b for AORs r67667712 (left panel) and r67667968 (right panel). Top row: raw photometric lightcurve with our best fit PLD model. Middle row: corrected lightcurves with the best fit eclipse model. Bottom row: RMS vs. binsize of the data; since this closely follows the photon noise line (![]() ) we can see that we are capturing the systematics well.
) we can see that we are capturing the systematics well.
Current usage metrics show cumulative count of Article Views (full-text article views including HTML views, PDF and ePub downloads, according to the available data) and Abstracts Views on Vision4Press platform.
Data correspond to usage on the plateform after 2015. The current usage metrics is available 48-96 hours after online publication and is updated daily on week days.
Initial download of the metrics may take a while.