Fig. 6
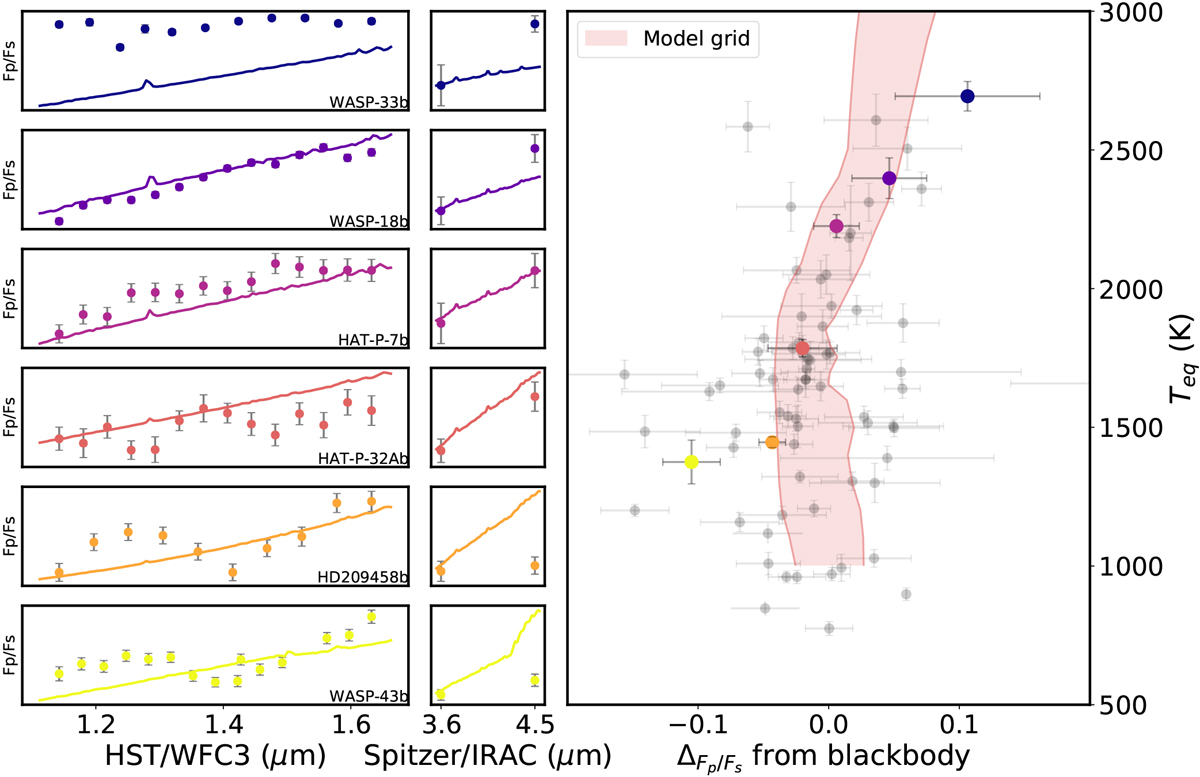
Right panel: deviation from the blackbody in the Spitzer bandpass against equilibrium temperature. Planets here demonstrate the continuous transition between the hot and the ultra-hot planets. Several planet with available HST spectra are highlighted and their spectra are plotted in the left (HST/WFC3) and middle (Spitzer) panels. These planets are color-coded by increasing temperature. For simplicity and clarity, we show only six of the HST spectra as examples. The models shown in the left and middle panels are the blackbody at
![]() and PHOENIX model ratio emission spectra. The model overplotted on the rightmost panel is the emission model grid described in Sect. 3.4.
and PHOENIX model ratio emission spectra. The model overplotted on the rightmost panel is the emission model grid described in Sect. 3.4.
Current usage metrics show cumulative count of Article Views (full-text article views including HTML views, PDF and ePub downloads, according to the available data) and Abstracts Views on Vision4Press platform.
Data correspond to usage on the plateform after 2015. The current usage metrics is available 48-96 hours after online publication and is updated daily on week days.
Initial download of the metrics may take a while.