Fig. 4
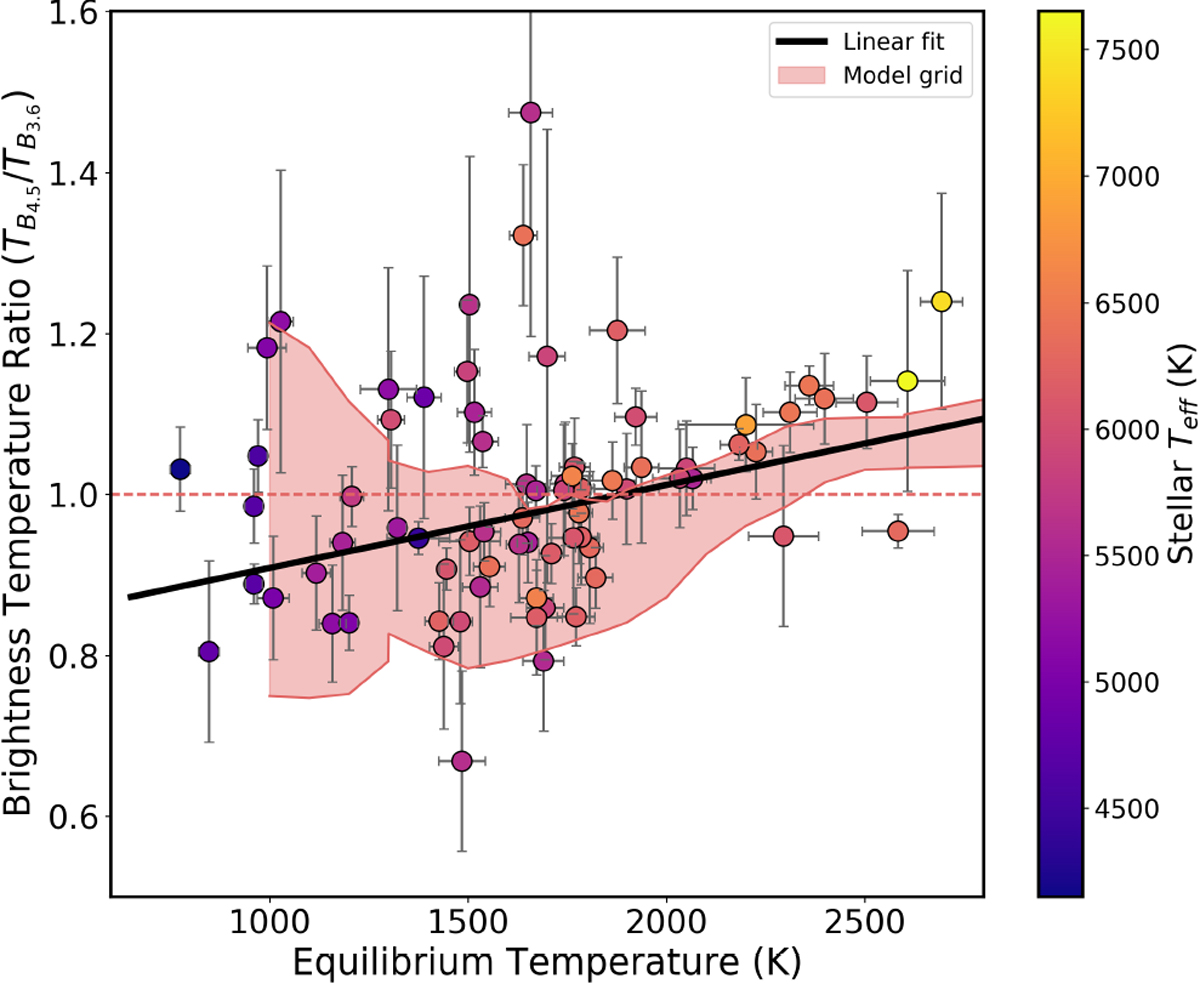
Brightness temperature ratio (![]() ) vs the equilibrium temperature (Teq,0) of all of the available planets with secondary eclipses measured with Spitzer/IRAC. The blue line shows an ODR fit to the data with a slope significance of 3.1σ. Several functions were tested (see Sect. 4.2) and the model with the lowest BIC is plotted as a straight line. The orange shaded area shows the span of the ScCHIMERA model grid described in Sect. 3.4. The color scale is the effective temperature of the star.
) vs the equilibrium temperature (Teq,0) of all of the available planets with secondary eclipses measured with Spitzer/IRAC. The blue line shows an ODR fit to the data with a slope significance of 3.1σ. Several functions were tested (see Sect. 4.2) and the model with the lowest BIC is plotted as a straight line. The orange shaded area shows the span of the ScCHIMERA model grid described in Sect. 3.4. The color scale is the effective temperature of the star.
Current usage metrics show cumulative count of Article Views (full-text article views including HTML views, PDF and ePub downloads, according to the available data) and Abstracts Views on Vision4Press platform.
Data correspond to usage on the plateform after 2015. The current usage metrics is available 48-96 hours after online publication and is updated daily on week days.
Initial download of the metrics may take a while.