Fig. 3
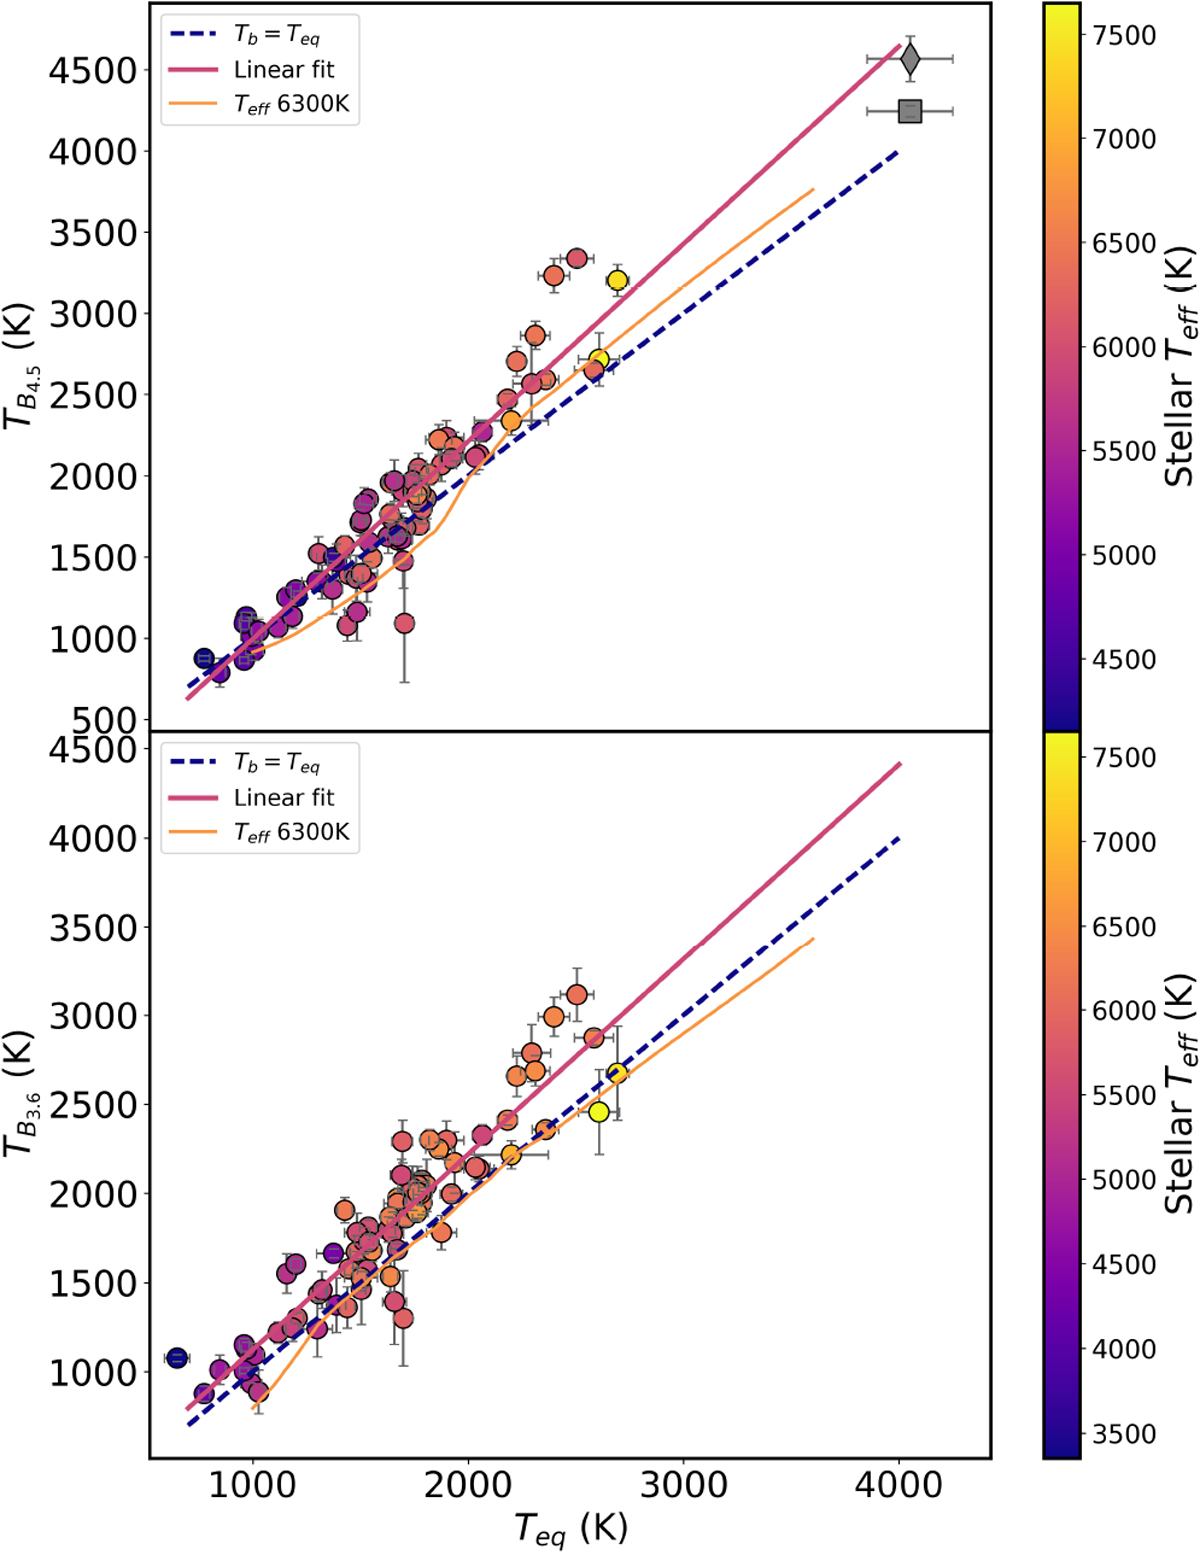
Brightness temperatures vs. Teq,0 (full redistribution, 0 albedo) at 3.6 μm (bottom panel) and 4.5 μm (top panel). Magenta trend lines show a linear ODR fit to the data (gradient in the legends) and the blue dashed line shows the TB = Teq,0 slope (gradient of 1). The gray points are the 4.5 μm brightness temperatures of KELT-9b: the square is our analysis presented in Appendix D, and the diamond is the analysis presented in Mansfield et al. (2020). Forward ScCHIMERA models are displayed in orange for one stellar effective temperature of 6300 K.
Current usage metrics show cumulative count of Article Views (full-text article views including HTML views, PDF and ePub downloads, according to the available data) and Abstracts Views on Vision4Press platform.
Data correspond to usage on the plateform after 2015. The current usage metrics is available 48-96 hours after online publication and is updated daily on week days.
Initial download of the metrics may take a while.