Fig. 2
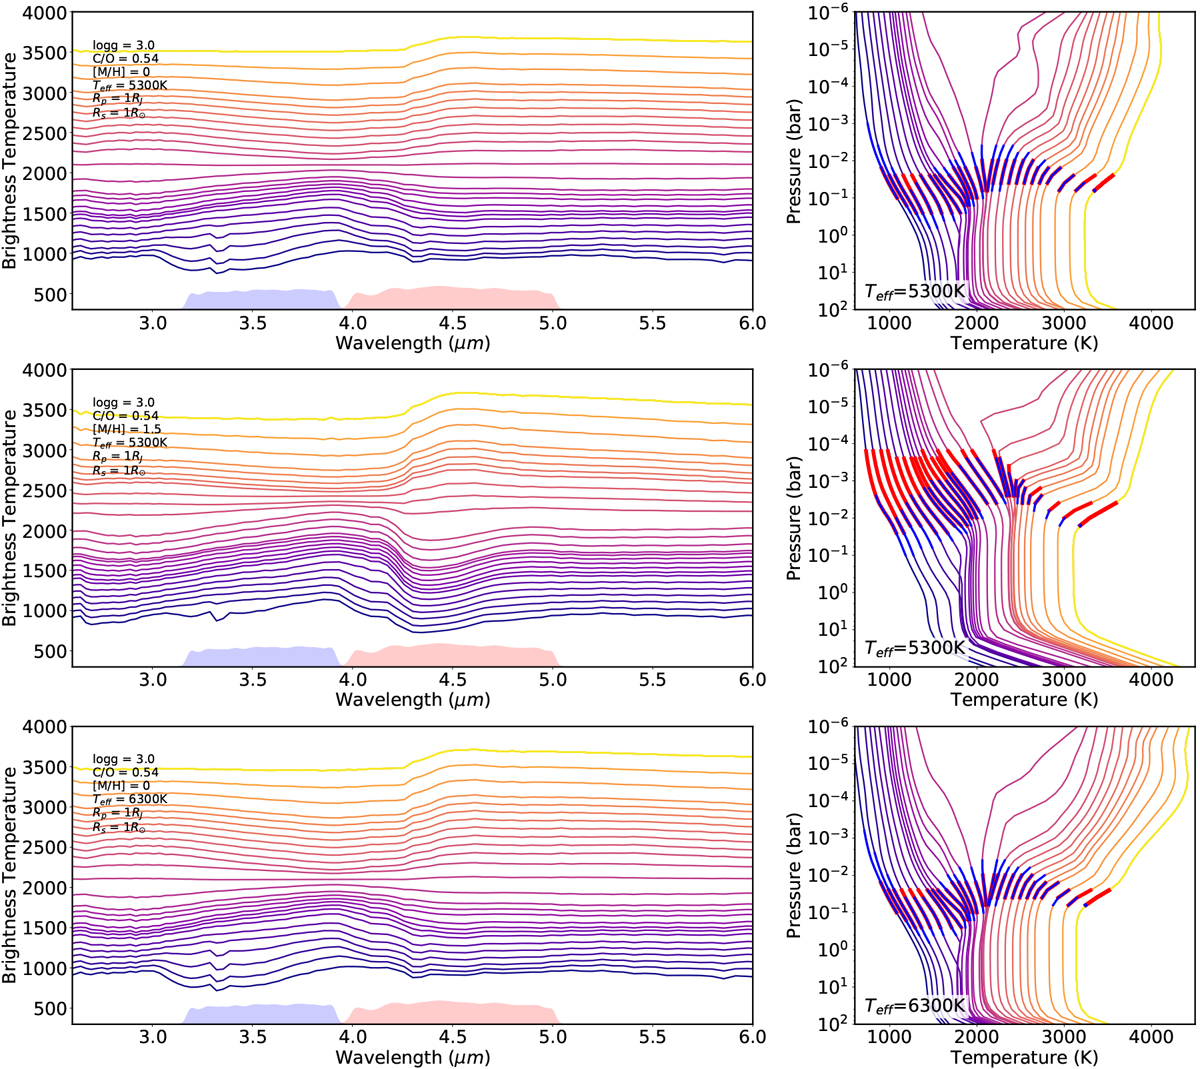
ScCHIMERA model emission spectra for hot Jupiters (Piskorz et al. 2018) for a set of models of varying equilibrium temperature with log (g) = 3.0, C/O = 0.54, [M/H] = 0, Rp = 1 RJ, and R* = 1 R⊙ . In each row we show the flux ratio (left) and temperature pressure profiles (right) for the 1D atmospheres of planets with colors indicating the increasing equilibrium temperatures ranging from 1000 to 3600 K (in 100 K increments). Top, middle, and bottom rows: grid for planets around a 4300, 5300, and a 6300 K star, respectively. Blue and red shaded regions in the left panel indicate the Spitzer/IRAC 3.6 and 4.5 μm bandpasses, respectively. Blue and red bold lines on the TP profiles correspond to the FWHM of the weighting functions for the 3.6 and 4.5 μm channels.
Current usage metrics show cumulative count of Article Views (full-text article views including HTML views, PDF and ePub downloads, according to the available data) and Abstracts Views on Vision4Press platform.
Data correspond to usage on the plateform after 2015. The current usage metrics is available 48-96 hours after online publication and is updated daily on week days.
Initial download of the metrics may take a while.