Fig. 1
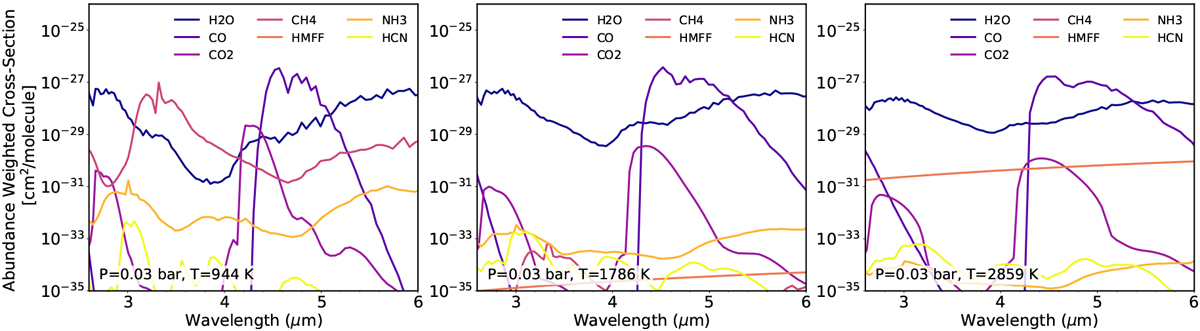
Abundance weighted cross sections for a selection of the emission model grid described in Sect. 3.4, (Piskorz et al. 2018). Each panel presents the abundance weighted cross sections for planets with equilibrium temperatures of 1000, 1800, and 3000 K. Each TP profile is for a planet around a 5300 K star with C/carbon to oxygen (O=) 0.54, [M/H] = 0.0, log g = 3.0; the full grid is shown in the first panel of Fig. 2. The plotted abundances are taken from a pressure of 30 mbar, resulting in probing temperatures of 944, 1786, and 2859 K in each of the respective TP profiles.
Current usage metrics show cumulative count of Article Views (full-text article views including HTML views, PDF and ePub downloads, according to the available data) and Abstracts Views on Vision4Press platform.
Data correspond to usage on the plateform after 2015. The current usage metrics is available 48-96 hours after online publication and is updated daily on week days.
Initial download of the metrics may take a while.