Fig. 9.
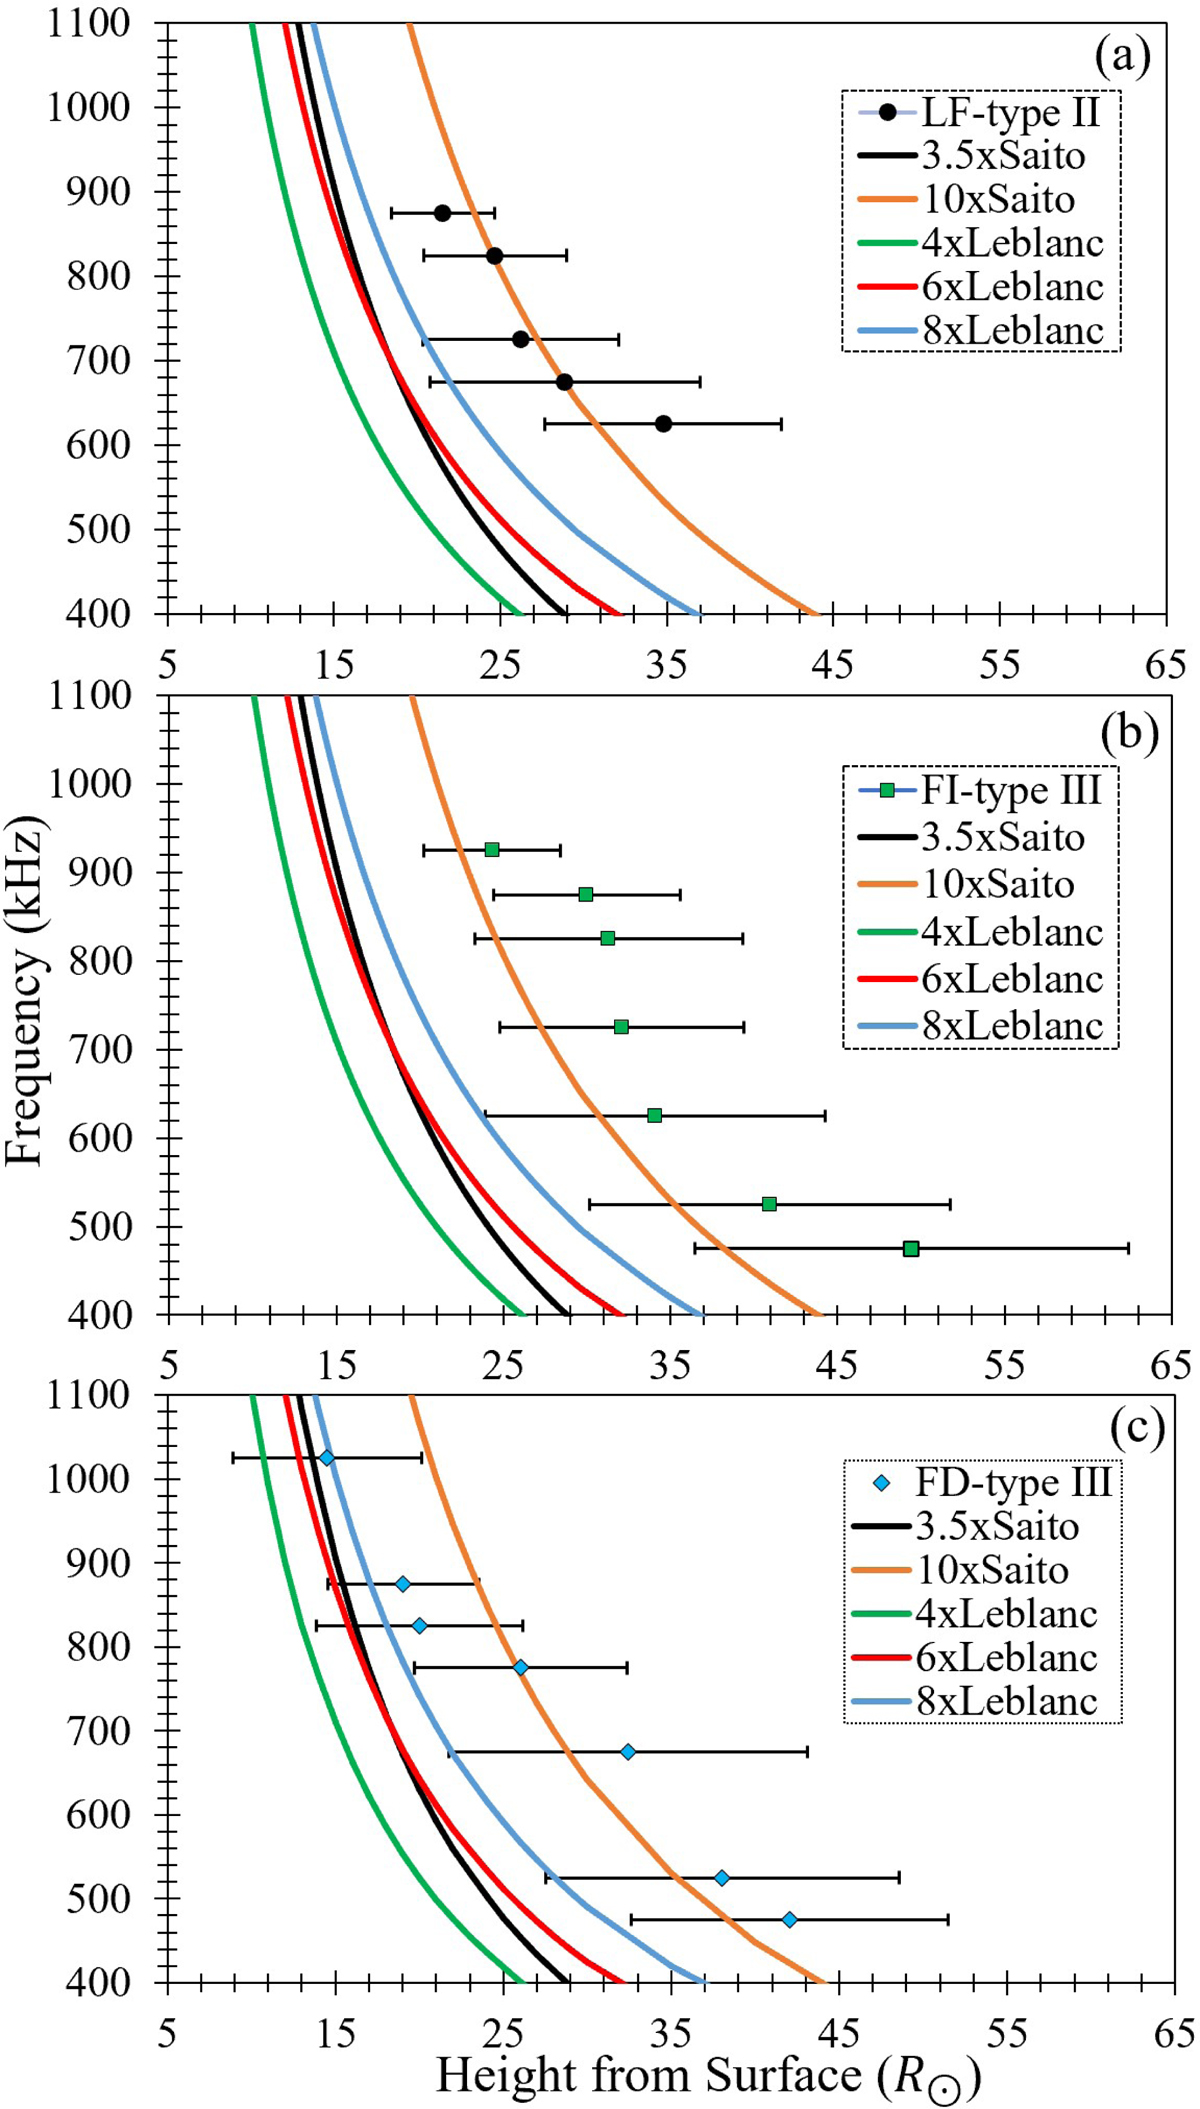
Frequency shown as a function of heliocentric distance. Radio triangulation results are plotted together with two density models (Saito, Leblanc) for comparison. The markers show the source positions of three different radio bursts and the bars attached to them show the distance between the wave vectors. Panel a: the black spheres show LF-type II, panel b: FI-type III is noted by the green squares, and panel c: the blue diamonds indicate the FD-type III.
Current usage metrics show cumulative count of Article Views (full-text article views including HTML views, PDF and ePub downloads, according to the available data) and Abstracts Views on Vision4Press platform.
Data correspond to usage on the plateform after 2015. The current usage metrics is available 48-96 hours after online publication and is updated daily on week days.
Initial download of the metrics may take a while.