Fig. 8.
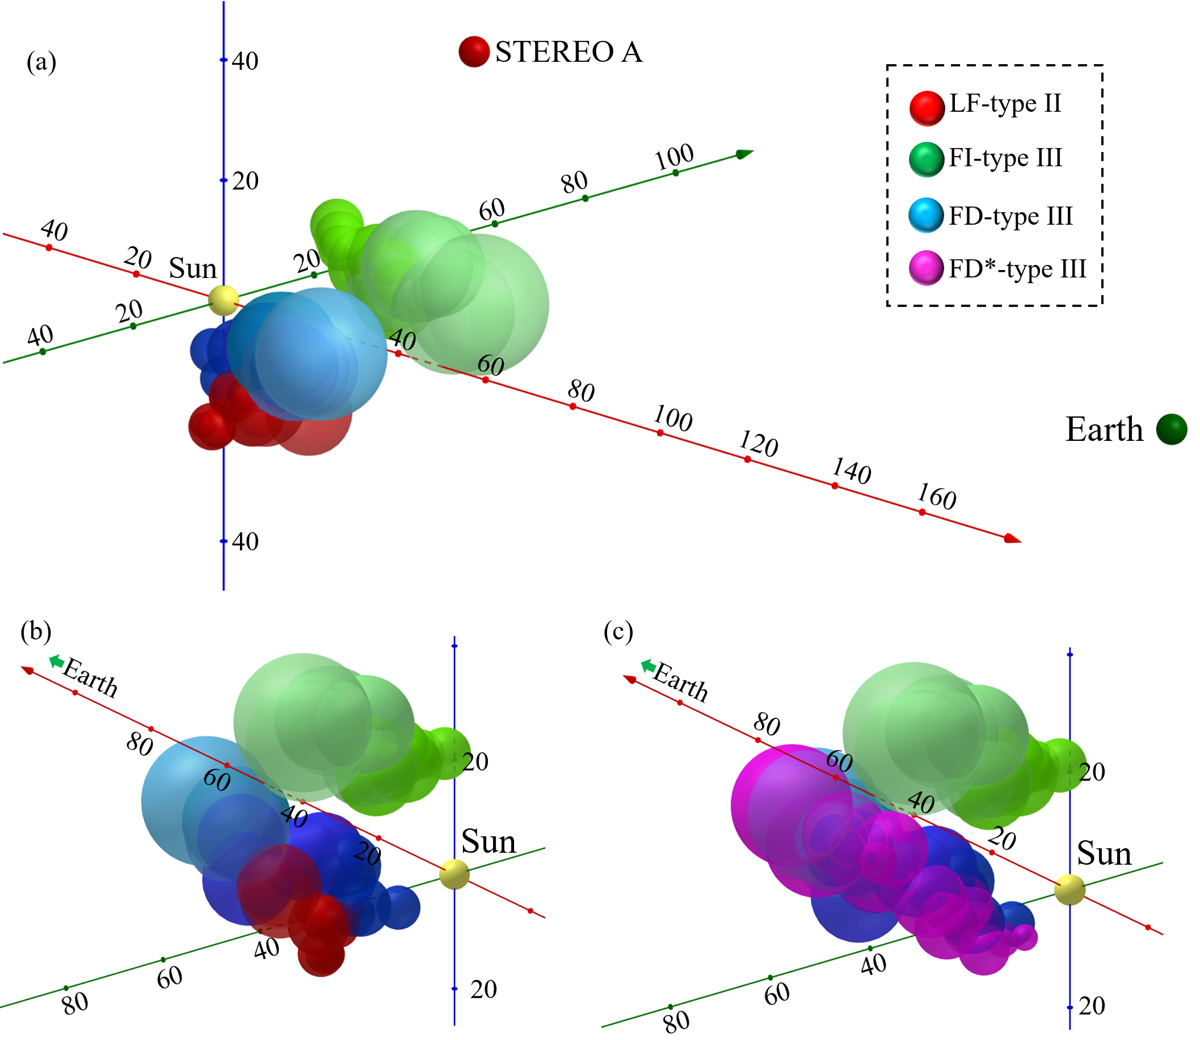
Panel a: results from radio triangulation studies of type II and type III radio bursts. The yellow sphere represents the Sun, while the red and green spheres represent STEREO A, STEREO B and Wind, respectively. The spheres of varying size represent the radio source regions. The green spheres mark the radio source positions of the FI-type III close to the CME flank. The LF-type II and the FD-type III, denoted by the red and blue spheres, have source positions at the southeast side of the Sun, i.e. close to another CME flank. Panel b: FI-type III, FD-type III, and LF-type II plotted from a different perspective. Panel c: three different type IIIs plotted together.
Current usage metrics show cumulative count of Article Views (full-text article views including HTML views, PDF and ePub downloads, according to the available data) and Abstracts Views on Vision4Press platform.
Data correspond to usage on the plateform after 2015. The current usage metrics is available 48-96 hours after online publication and is updated daily on week days.
Initial download of the metrics may take a while.