Free Access
Fig. 4.
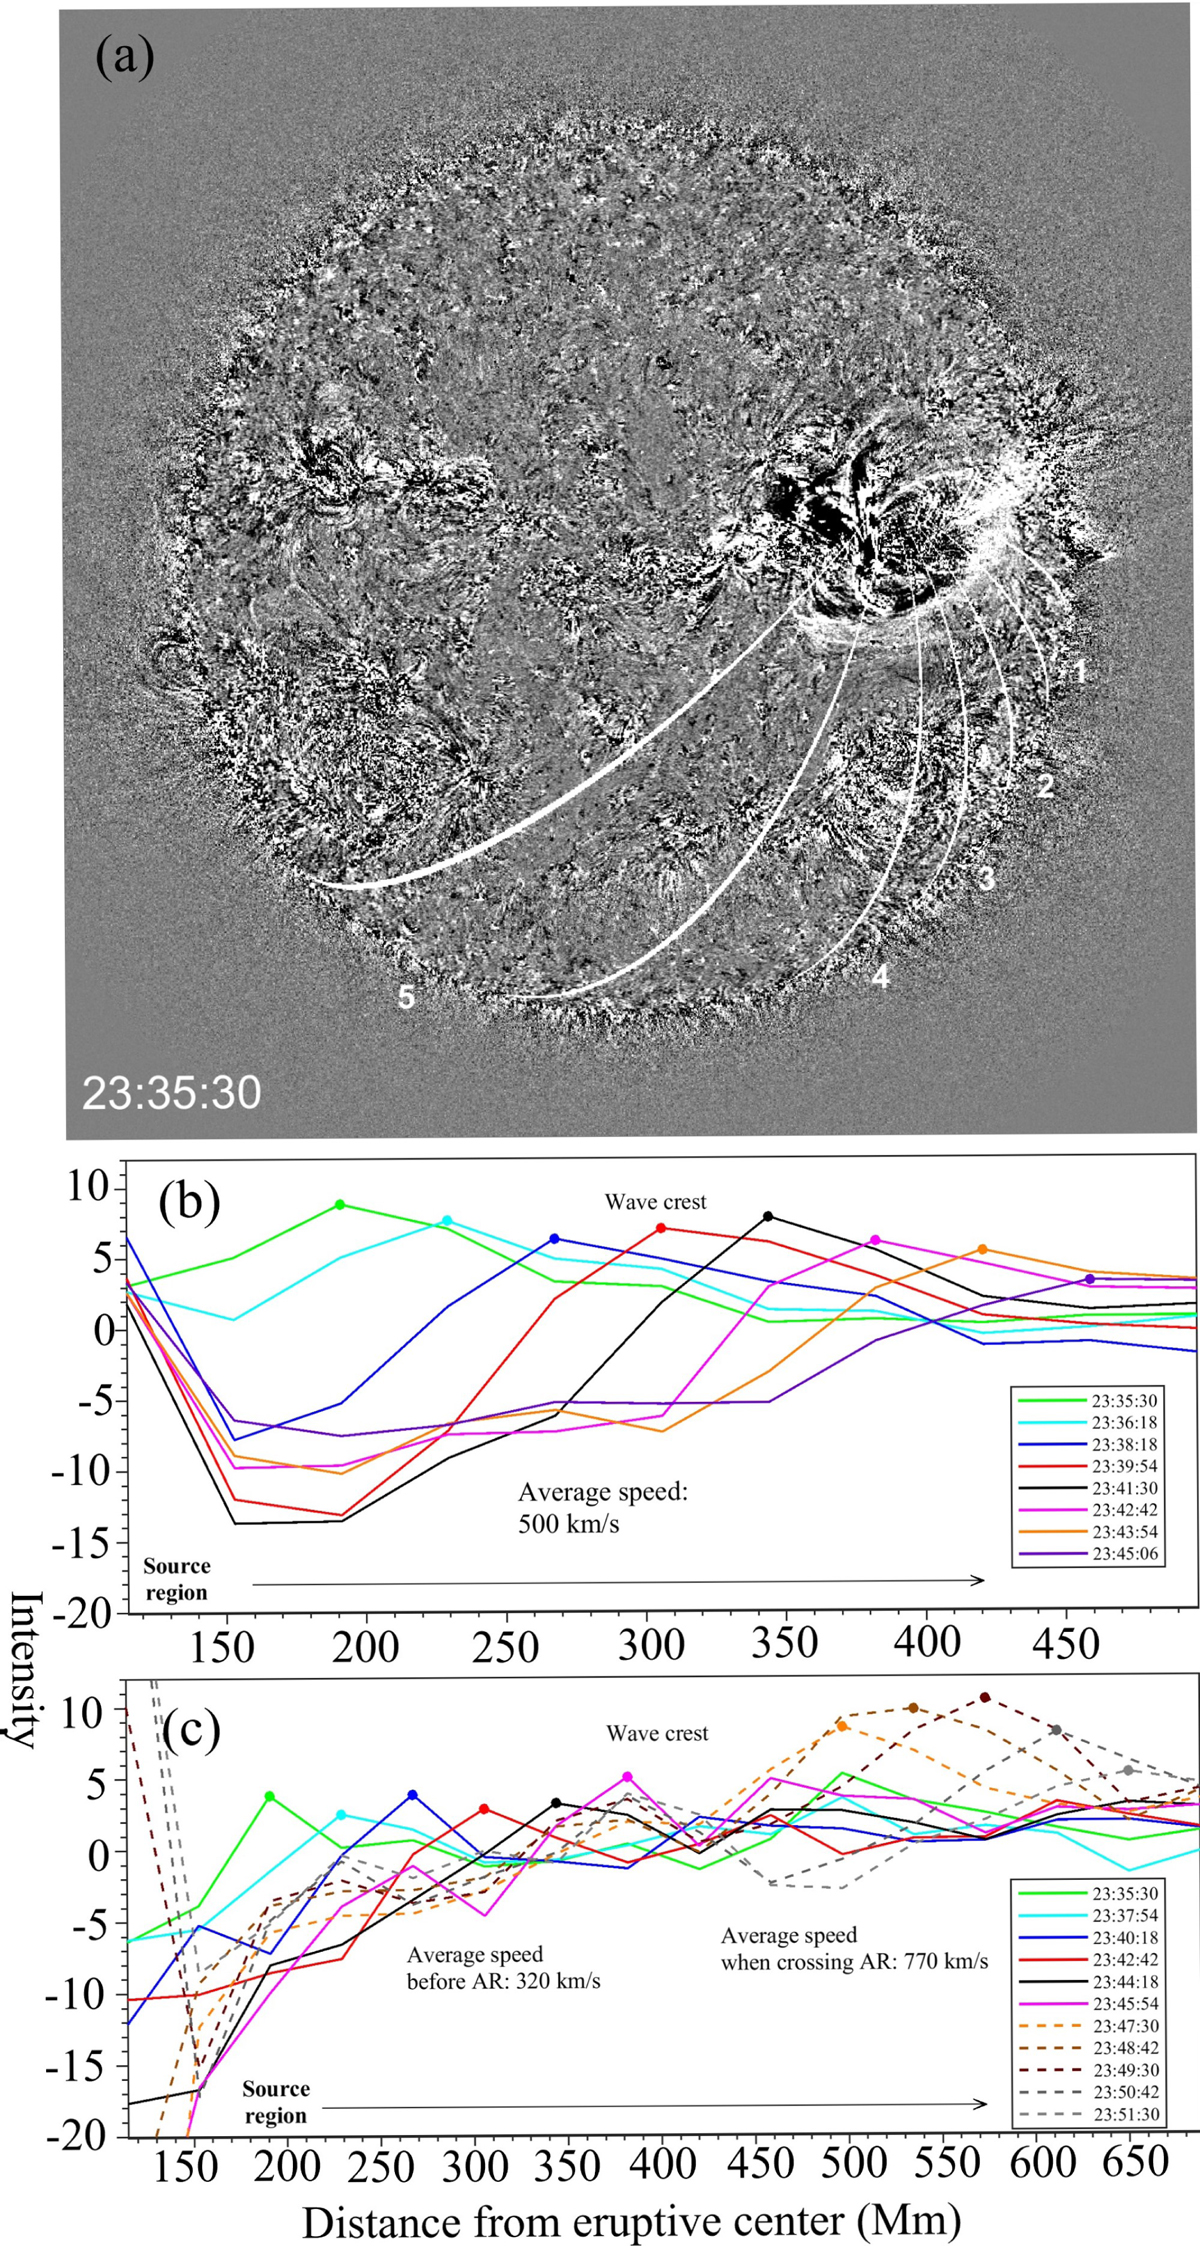
Panel a: EIT wave observed by the SDO/AIA 193 Å filter. The region where the EIT wave was most pronounced is divided into five sectors. Panel b: evolution of the EIT wave profiles in sector 2, revealing a fast decay. Panel c: evolution of the EIT wave in sector 4.
Current usage metrics show cumulative count of Article Views (full-text article views including HTML views, PDF and ePub downloads, according to the available data) and Abstracts Views on Vision4Press platform.
Data correspond to usage on the plateform after 2015. The current usage metrics is available 48-96 hours after online publication and is updated daily on week days.
Initial download of the metrics may take a while.