Fig. 3.
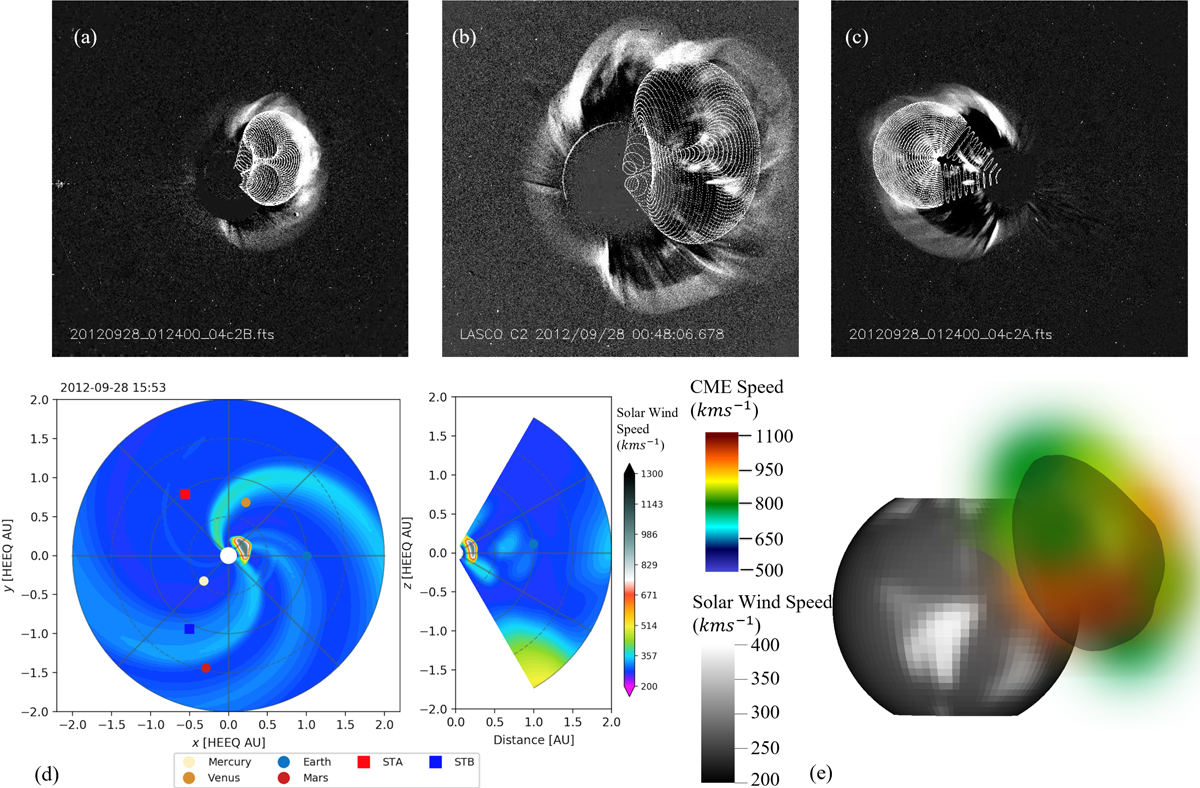
Panels a–c: graduated cylindrical shell (GCS) reconstruction of the CME body. Coronagraph images from: (a) STEREO B/COR 2, (b) SOHO/LASCO C3, and (c) STEREO A/COR 2 at roughly the same time (September 28, 2012 at 01:24 UT). Panels d and e: CME modelled by EUHFORIA. (d) Propagation of the modelled cone CME in the ecliptic and meridional perspectives. (e) CME speeds at the cone surface as seen from Earth. The grey sphere shows the solar wind radial velocity at the inner boundary of EUHFORIA (0.1 AU).
Current usage metrics show cumulative count of Article Views (full-text article views including HTML views, PDF and ePub downloads, according to the available data) and Abstracts Views on Vision4Press platform.
Data correspond to usage on the plateform after 2015. The current usage metrics is available 48-96 hours after online publication and is updated daily on week days.
Initial download of the metrics may take a while.