Fig. 2.
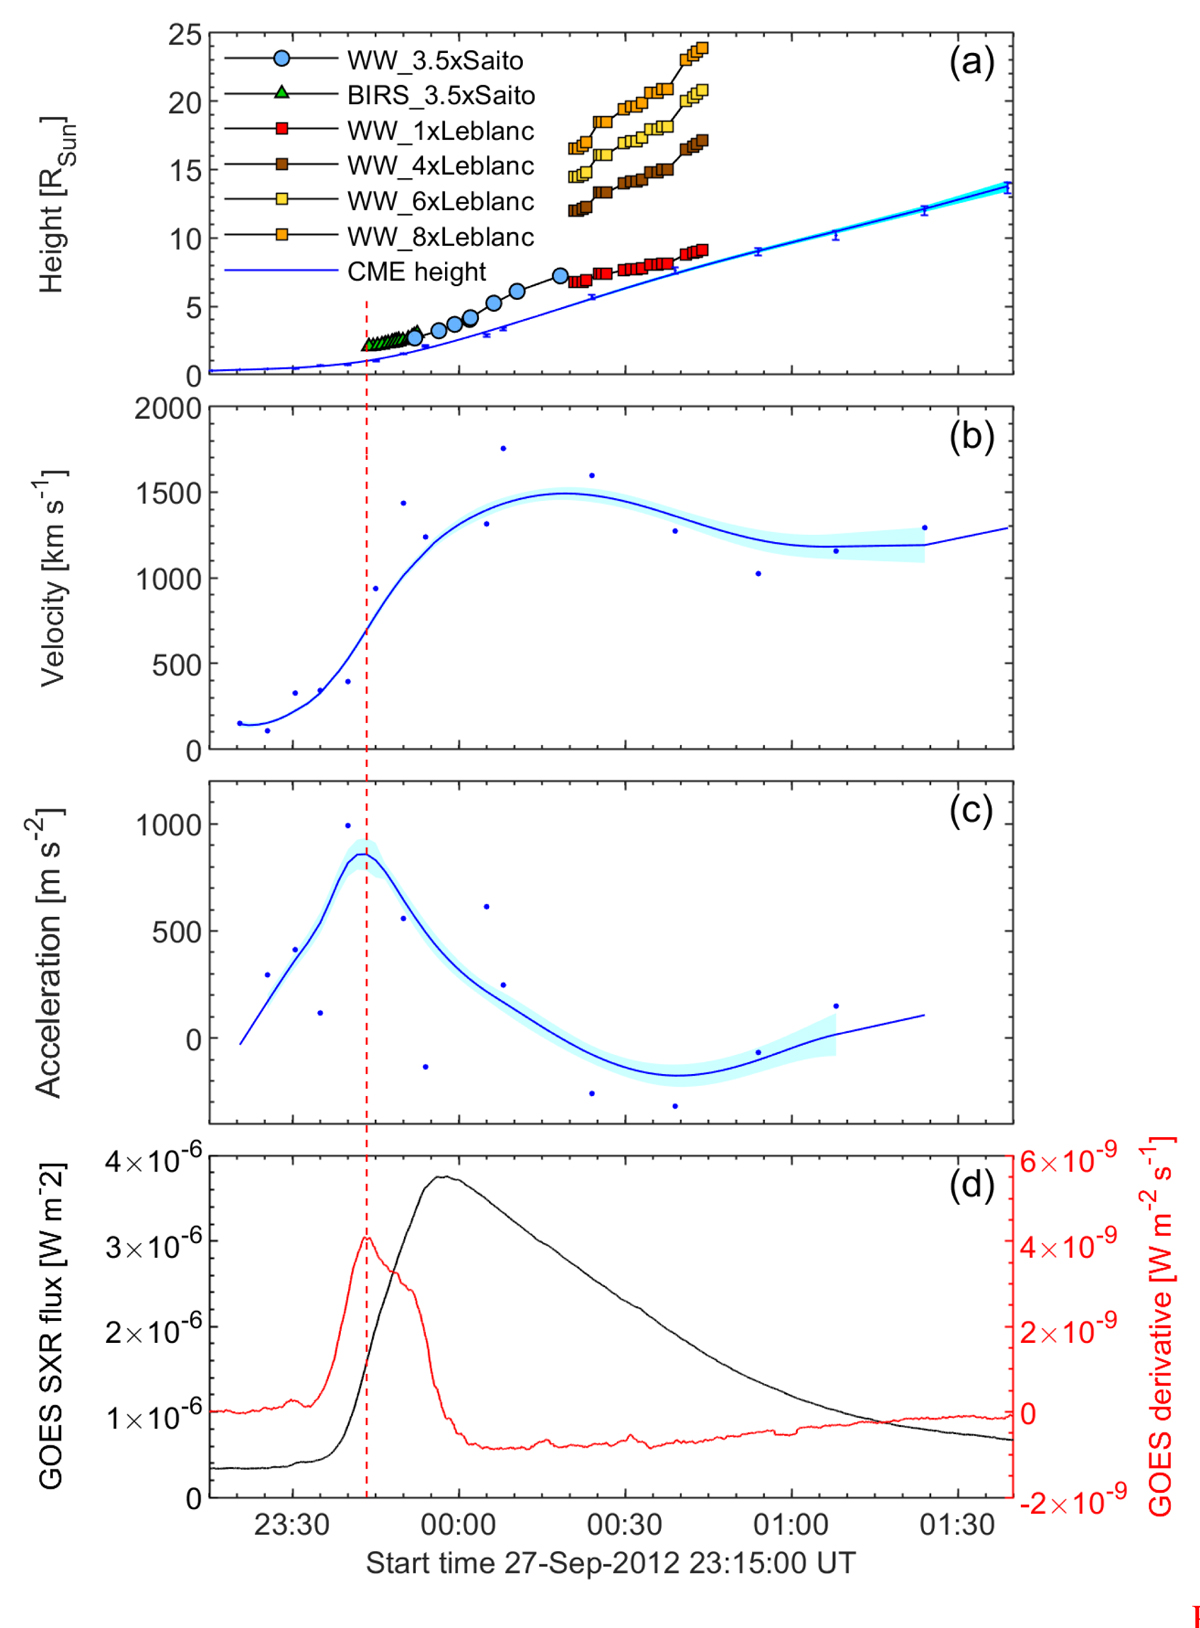
CME kinematics based on STEREO A/EUV and coronagraph images. Panel a: CME height (blue dots) together with error bars and radio emission heights. The corresponding line shows the smoothed height-time profile. HF-type II heights are obtained using a 3.5-fold Saito, while the LF-type II heights are obtained using 1-fold, 4-fold, 6-fold, and 8-fold Leblanc based on radio triangulation results discussed in Sect. 9. Panel b: CME velocity and panel c: acceleration profile obtained by numerical differentiation of the data points (circles) and the smoothed curves (lines). The shaded areas represent the error ranges obtained from the smoothed curves. Panel d: GOES soft X-ray flux and it’s derivative. The red vertical line denotes the peak of the GOES derivative
Current usage metrics show cumulative count of Article Views (full-text article views including HTML views, PDF and ePub downloads, according to the available data) and Abstracts Views on Vision4Press platform.
Data correspond to usage on the plateform after 2015. The current usage metrics is available 48-96 hours after online publication and is updated daily on week days.
Initial download of the metrics may take a while.