Fig. 14.
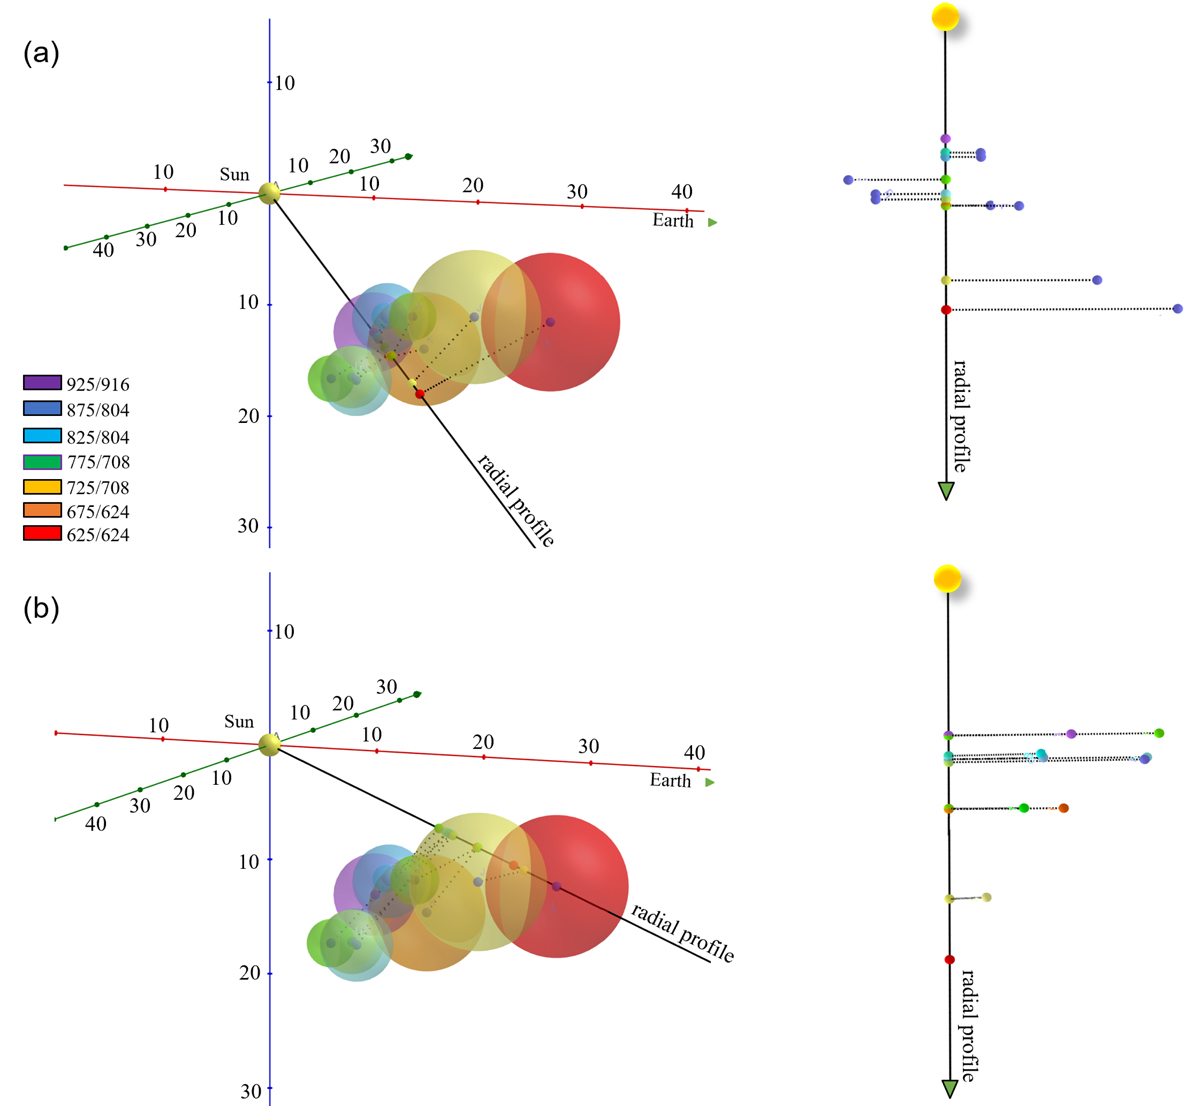
Radio triangulation results of LF-type II plotted in detail to show the effect of non-radial propagation of the emitting source. The units are solar radii (R⊙), and the Sun is at the center of the coordinate system. A ray is drawn from the centre of the Sun (0, 0, 0) or R⊙ = 0 to centres of different sources. Panel a: result when the ray is drawn employing the highest frequency (Purple, 925/916 kHz) pair. The projection is shown in detail in the line profile adjacent to it. Panel b: result when the ray is drawn towards the lowest frequency (Red, 625/624 kHz) pair. The result of the orthogonal projection is shown in the profile adjacent to it.
Current usage metrics show cumulative count of Article Views (full-text article views including HTML views, PDF and ePub downloads, according to the available data) and Abstracts Views on Vision4Press platform.
Data correspond to usage on the plateform after 2015. The current usage metrics is available 48-96 hours after online publication and is updated daily on week days.
Initial download of the metrics may take a while.