Fig. 12.
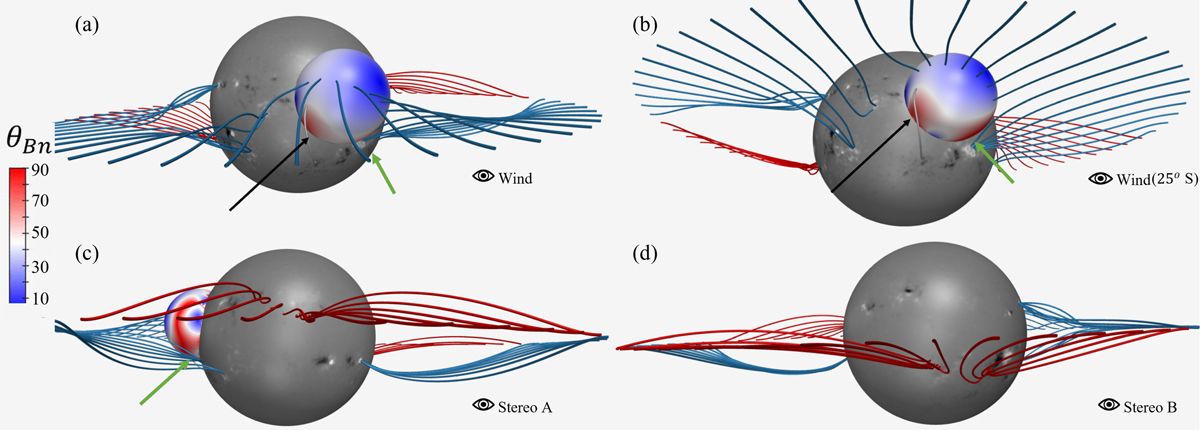
Reconstructed EIT wave bubble and its corresponding high coronal expansion using the measurements made in the analysis described in Sect. 5. The panels show the event as observed from the point of view of different spacecraft. The different panels show the EIT wave observed (a) by SDO/AIA; (b) from 25° south; (c) by STEREO A; and (d) by STEREO B. The coronal magnetic field was extrapolated using a PFSS model. The field line colours correspond to their polarity, with red being positive and blue negative. The shock wave bubble is plotted at the start time of the HF-type II (23:44 UT) and the colours on the surface of the bubble are the values of the shock normal angle (θBn) to the local magnetic field. The green arrow indicates the possible source region of the HF-type II while the black arrow is the possible region of the part of the shock wave which corresponds to the LF-type II burst.
Current usage metrics show cumulative count of Article Views (full-text article views including HTML views, PDF and ePub downloads, according to the available data) and Abstracts Views on Vision4Press platform.
Data correspond to usage on the plateform after 2015. The current usage metrics is available 48-96 hours after online publication and is updated daily on week days.
Initial download of the metrics may take a while.