Fig. 11.
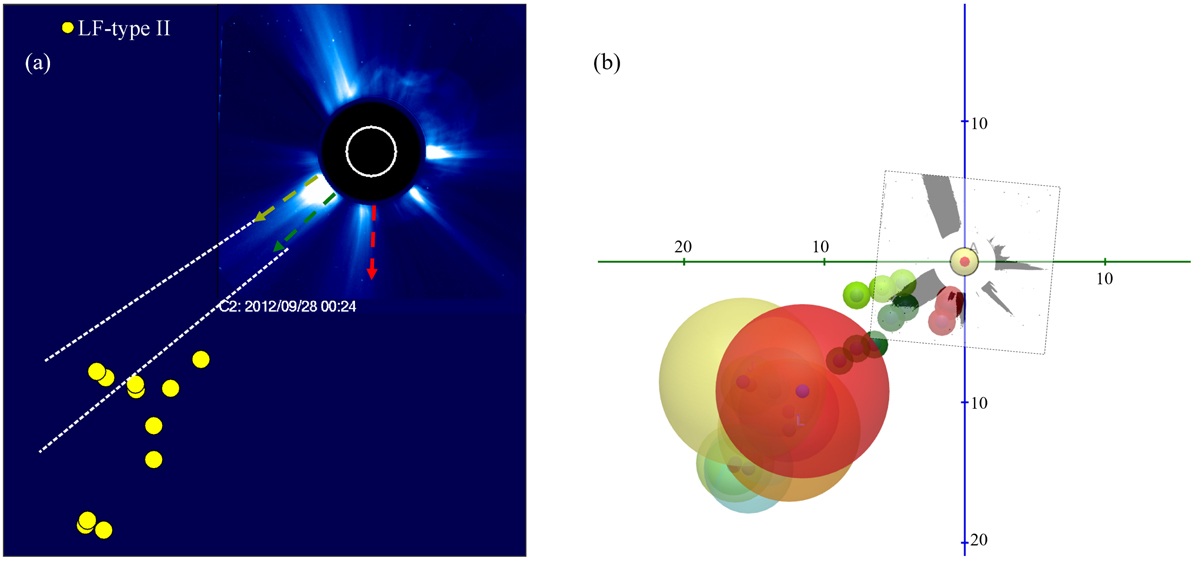
Panel a: centroids of the LF-type II emission projected on a SOHO/LASCO C2 image. Their proximity to the streamer stalk region in the plane of sky gives an indication of the probable shock/streamer interaction. Coloured arrows are the streamer regions selected for reconstruction. Panel b: reconstructed streamers (colour coded) plotted together with the type II source regions (distance between the wave vectors) in a plane-of-sky projection similar to the SOHO/LASCO C2 image. The different frequency pairs of the type II source regions are denoted by a rainbow colour scale (Blue hues: high-frequency pairs, Red hues: low-frequency pairs). The source regions of the type II burst are presented as spheres. The smaller spheres (green, olive, and red) are the positions of the reconstructed streamers.
Current usage metrics show cumulative count of Article Views (full-text article views including HTML views, PDF and ePub downloads, according to the available data) and Abstracts Views on Vision4Press platform.
Data correspond to usage on the plateform after 2015. The current usage metrics is available 48-96 hours after online publication and is updated daily on week days.
Initial download of the metrics may take a while.