Fig. 1.
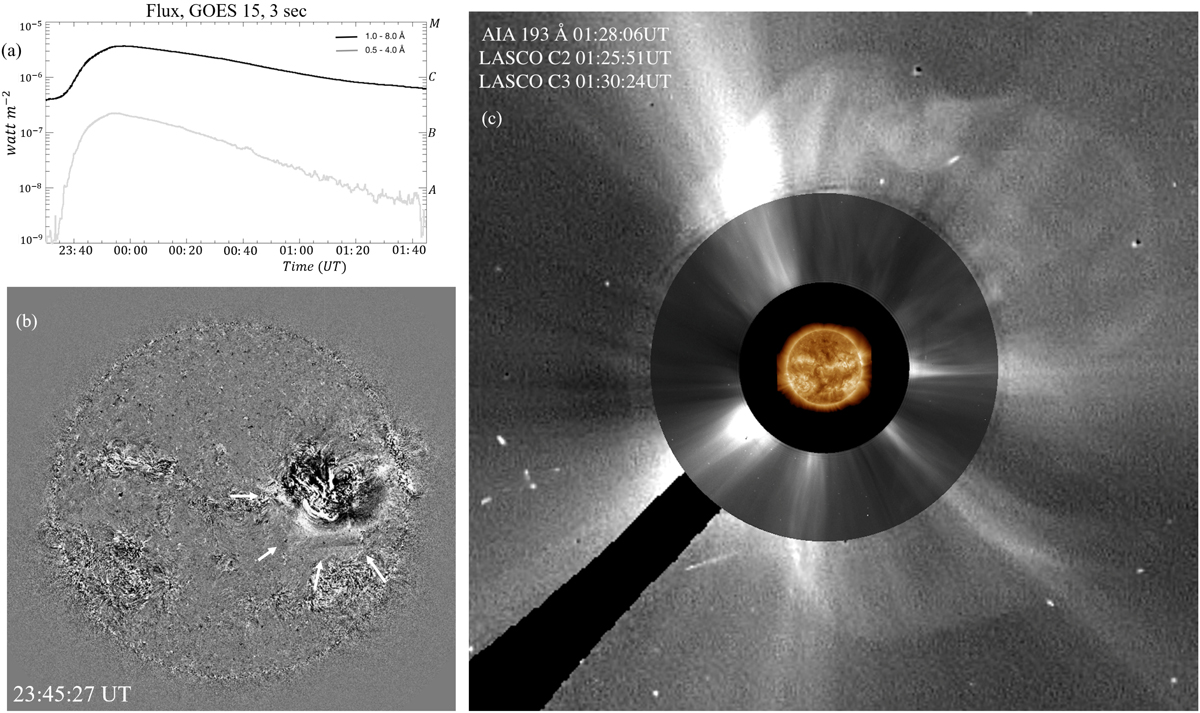
Overview of the CME/flare event: Panel a: the GOES C3.7 X-ray flare curve shows a rather long flare decay phase. Panel b: running difference image of the SDO/AIA 193 Å channel. The white arrows mark what appears to be an EIT wave. Panel c: combined images of the SDO/AIA observations at 193 Å and the SOHO/LASCO C2 and C3 observations around 01:30 UT.
Current usage metrics show cumulative count of Article Views (full-text article views including HTML views, PDF and ePub downloads, according to the available data) and Abstracts Views on Vision4Press platform.
Data correspond to usage on the plateform after 2015. The current usage metrics is available 48-96 hours after online publication and is updated daily on week days.
Initial download of the metrics may take a while.