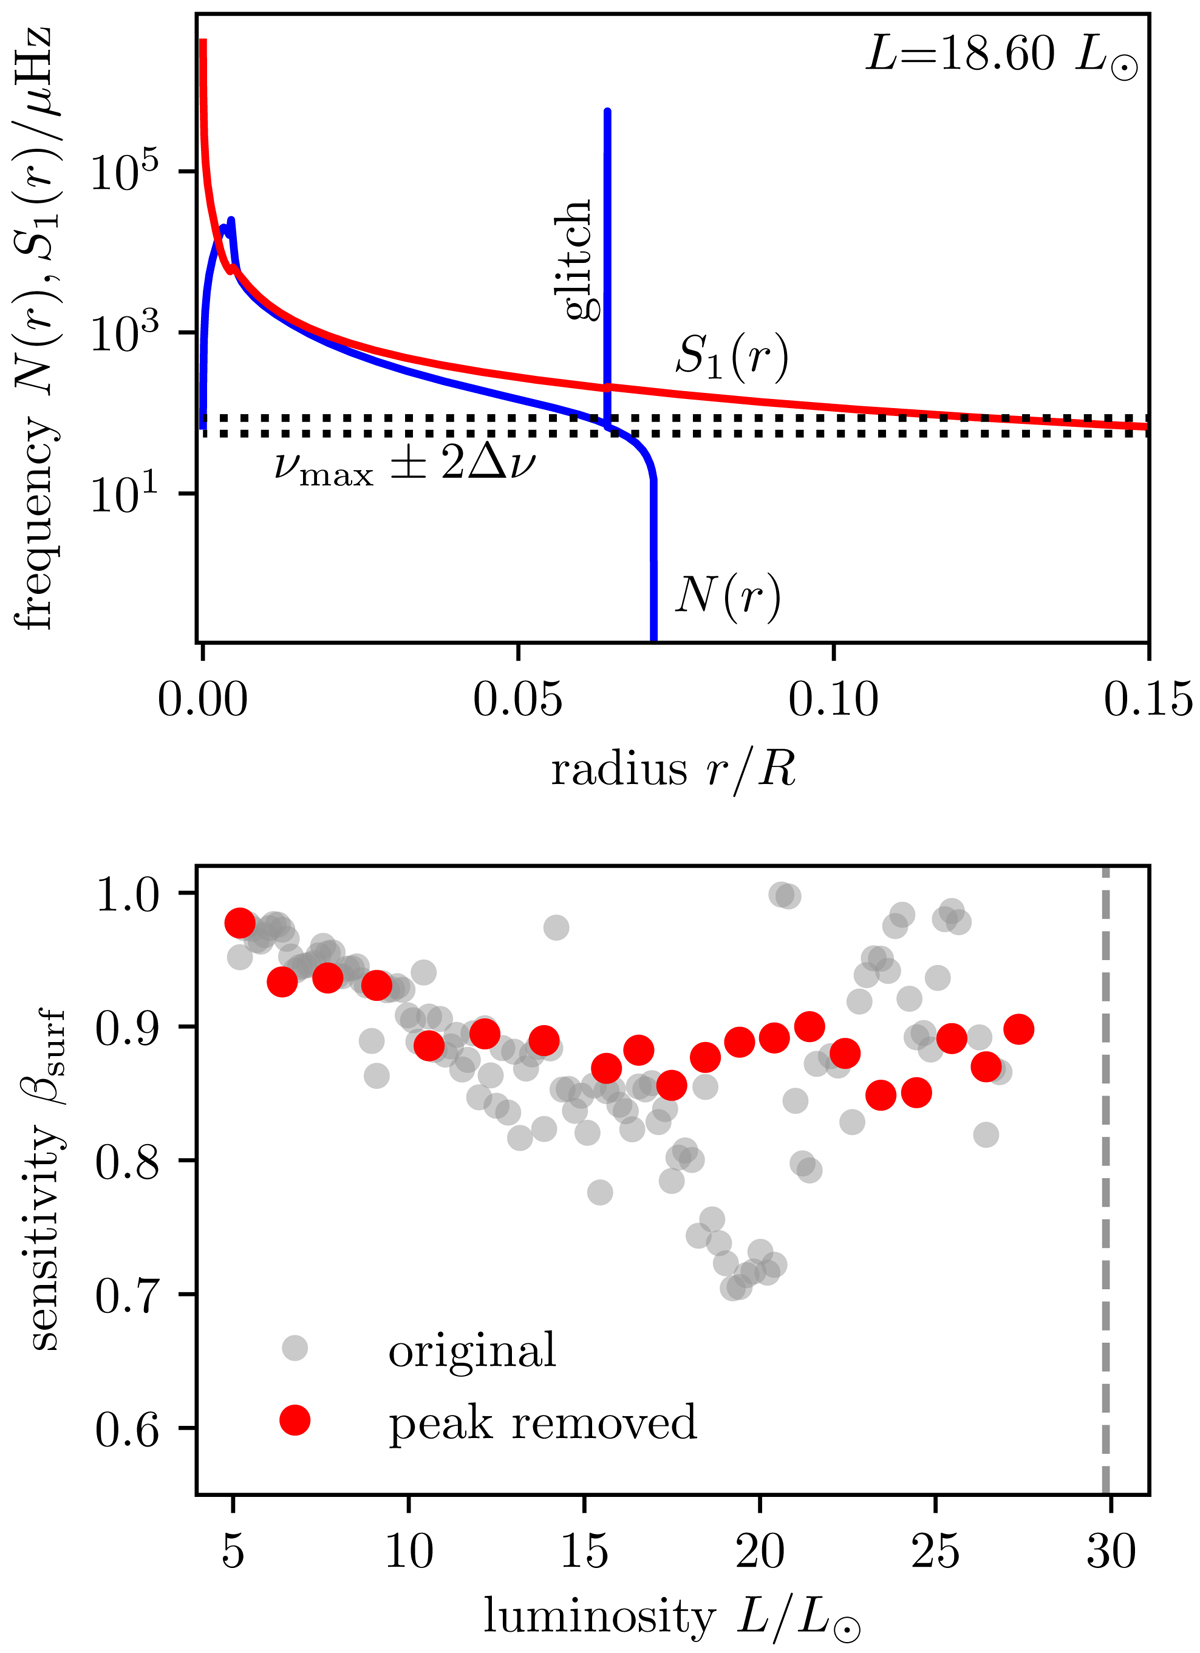
Fig. 4.

Upper panel: propagation diagram for a 1.0 M⊙ model in the vicinity of the surface-sensitivity minimum. Here, N indicates the buoyancy frequency and S1 indicates the Lamb frequency for l = 1 modes. The frequency range of the dipole modes used for the rotational inversions is indicated with two horizontal dotted lines. Lower panel: surface sensitivity as a function of stellar luminosity. Red dots indicate inversion results for models where the peak associated with the composition discontinuity has been removed manually from the buoyancy frequency. Grey dots show the original inversion results from the upper panel of Fig. 2 for comparison.
Current usage metrics show cumulative count of Article Views (full-text article views including HTML views, PDF and ePub downloads, according to the available data) and Abstracts Views on Vision4Press platform.
Data correspond to usage on the plateform after 2015. The current usage metrics is available 48-96 hours after online publication and is updated daily on week days.
Initial download of the metrics may take a while.


