Fig. 9.
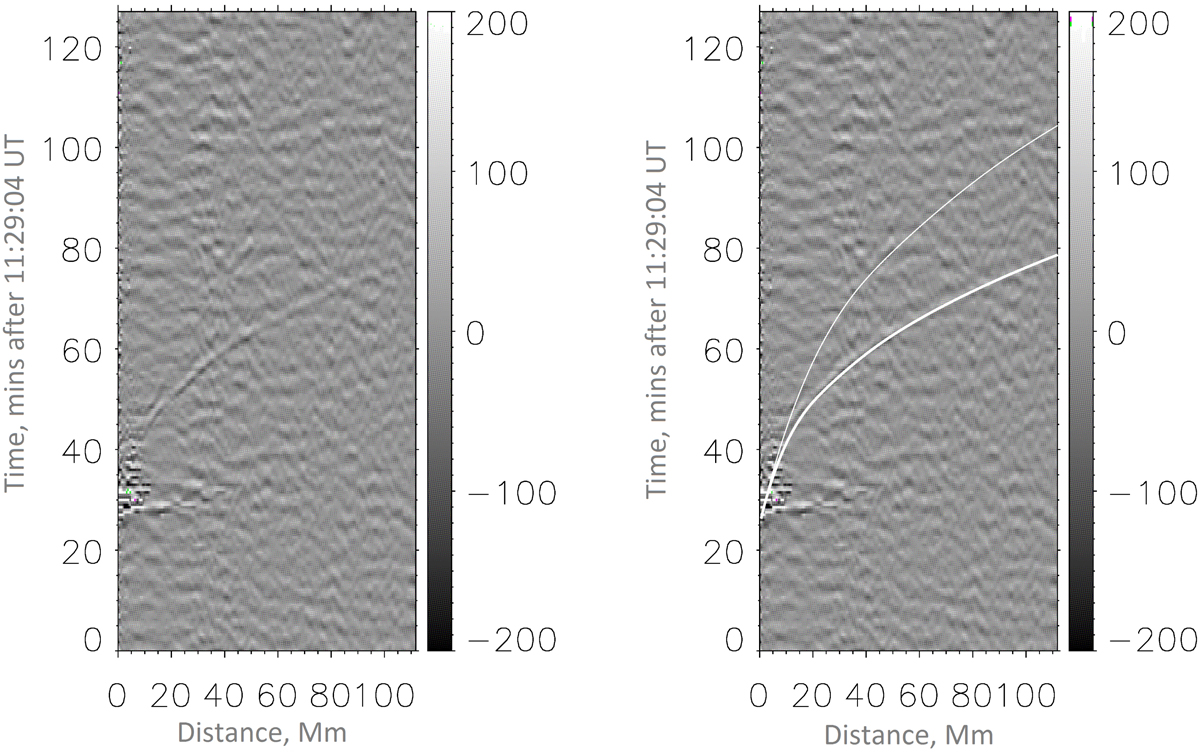
Time–distance diagram for the seismic source 2, obtained from the filtered HMI dopplergram without (left) and with (right) theoretical curves. The TD diagram shows the ridge derived from ripples produced at some distance from the event location by acoustic waves in their first bounce from the photosphere (lower white line) and the second bounce (upper white line). The start (zero) time on the Y-axis is 11:29.04 UT, which corresponds to the shock deposition and seismic response initiation at 11:55:37 UT. The grey colour bars on the right show the background Doppler velocities in m/s.
Current usage metrics show cumulative count of Article Views (full-text article views including HTML views, PDF and ePub downloads, according to the available data) and Abstracts Views on Vision4Press platform.
Data correspond to usage on the plateform after 2015. The current usage metrics is available 48-96 hours after online publication and is updated daily on week days.
Initial download of the metrics may take a while.